How to Subtotal Data in Excel 2013
You can use Excel’s Subtotals feature to subtotal data in a sorted list. To subtotal a data list, you first sort the list on the field for which you want the subtotals, and then you designate the field that contains the values you want summed — these don’t have to be the same fields in the data list.
When you use the Subtotals feature, you aren’t restricted to having the values in the designated field added together with the SUM function. You can instead have Excel return the number of entries with the COUNT function, the average of the entries with the AVERAGE function, the highest entry with the MAXIMUM function, the lowest entry with the MINIMUM function, or even the product of the entries with the PRODUCT function.
To subtotal the salaries within each department in my example Employee Data list, first sort the list in A-to-Z order on the Dept column because Excel is to create a new subtotal at each change in the department entries within the list (Accounting, Administration, Engineering, and so on).
Excel does not allow you to subtotal a data list formatted as a table. Before you can use the Subtotal command button, you must first convert your table into a normal range of cells. To do this, click a cell in the table and then click the Design tab on the Table Tools contextual tab on the Ribbon.
Finally, click the Convert to Range command button in the Tools group followed by the Yes button in the alert dialog box asking you to confirm this action. Excel then removes the filter buttons from the columns at the top of the data list while still retaining the original table formatting.
The following figure illustrates how easy it is to use the Subtotals feature to obtain totals in a data list. The sample Employee data list is sorted first by the Dept field in ascending order and then by the Salary field in descending order (Largest to Smallest) and converted the data list to a range.
Then click the Subtotal command button on the Ribbon’s Data tab to open the Subtotal dialog box.
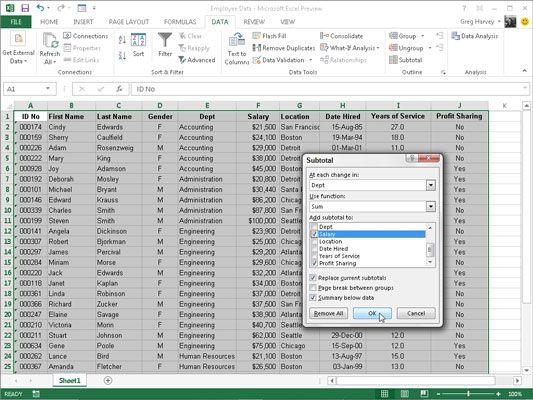
Here, the Dept field is selected as the field for which the subtotals are to be calculated in the At Each Change In drop-down list box, Sum as the function to use in the Use Function drop-down list box, and the Salary check box as the field whose values are to be summed in the Add Subtotal To list box.
The following figure shows the results obtained after clicking OK in the Subtotal dialog box. Here, you see the bottom of the data list showing the salary subtotals for the Administration, Engineering, Human Resources, and Information Services departments along with the grand total of the salaries for all the departments.
The grand total is displayed at the bottom of the data list because the Summary below Data check box is selected in the Subtotal dialog box — if you didn't want a grand total, remove the check mark from this check box.
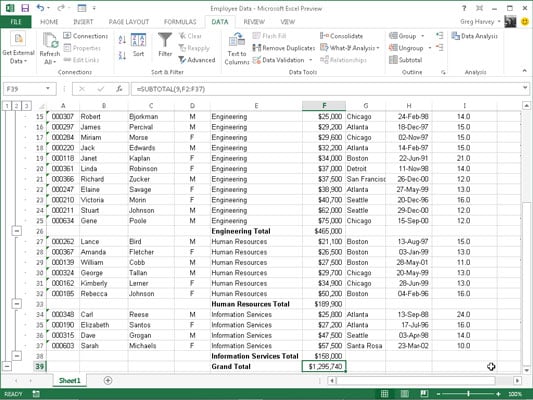
As you can see, when you use the Subtotals command, Excel outlines the data at the same time that it adds the rows with the departmental salary totals and the grand total. This means that you can collapse the data list down to just its departmental subtotal rows or even just the grand total row simply by collapsing the outline down to the second or first level.
(Remember that you can toggle between showing and hiding the outline symbols at the left edge of the data list by pressing Ctrl+8.)
In a large data list, you may want Excel to insert page breaks (often referred to as breaks) every time data changes in the field on which the list is being subtotaled (that is, the field designated in the At Each Change In drop-down list box).
To do this, you simply select the Page Break between Groups check box in the Subtotal dialog box to put a check mark in it before you click OK to subtotal the list.

Excel Glossary
active cell
The worksheet cell that contains the cell cursor. Each worksheet can have only one active cell.

Excel Glossary
AutoComplete
A feature that looks at the entries that you make in a worksheet column and automatically duplicates them in subsequent rows whenever you start a new entry that begins with the same letter or letters as an existing entry in that column.

Excel Glossary
AutoCorrect
A feature that alerts Excel 2007 to common typing errors and your own typing errors (that you specify) and tells the program how it should automatically fix them for you.

Excel Glossary
AutoFill
An Excel 2007 feature that quickly creates a series of entries based on the data you enter in one or two cells. AutoFill works with days of the week, months of the year, yearly quarters; consecutive series of numbers; and formulas. You also can add your own custom AutoFill series.

Excel Glossary
AutoFilter
A feature in Excel 2010 that enables you to temporarily hide everything in a table except the records you specifically want to view, based on criteria you specify.

Excel Glossary
Backstage view
A new feature in Excel 2010 — accessible from the green File tab — that enables you to manage files and to view the properties and stats about the workbook file you're editing.

Excel Glossary
cell
The intersection of a column and row in the worksheet.

Excel Glossary
cell address
The cell identifier, determined by its column letter(s) followed by the row number, as in cell A1, the very first cell of each worksheet at the intersection of column A and row 1.

Excel Glossary
cell cursor
The black border that surrounds the active cell in a worksheet.

Excel Glossary
clip art
Readymade drawings, illustrations, and photos offered by Microsoft for use in Microsoft Office applications.

Excel Glossary
Compatibility Checker
A utility in Excel 2007 and 2010 that you use to find potential compatibility issues if you plan to save an Excel workbook file in the older Excel 97–2003 file format.

Excel Glossary
current cell
The worksheet cell that contains the cell cursor. Each worksheet can have only one current cell.

Excel Glossary
data table
A range of cells in a worksheet in which you enter a series of possible values that Excel plugs into a formula so you can perform what-if analysis on the data.

Excel Glossary
dialog box
A rectangular window with settings and commands that appears when you click a dialog box launcher or certain other commands on the Ribbon.

Excel Glossary
dialog box launcher
A small icon in the lower-right corner of a group of command buttons on the Ribbon that you click to access a dialog box with additional related settings and commands.

Excel Glossary
function
A part of a formula that takes a number of specific arguments and then returns a single value based on those arguments.

Excel Glossary
gallery
A drop-down list of thumbnail selections that appears when you click certain command buttons on the Ribbon.

Excel Glossary
group
A section of a tab on the Excel 2007 Ribbon that organizes related command buttons into subtasks normally performed as part of the tab's larger core task. The name of a group appears at the bottom of the group, such as the Font group on the Home tab.

Excel Glossary
hyperlink
Specially formatted text that anyone can click to jump to Web sites, move to other cells or workbooks, or create an e-mail message.

Excel Glossary
keyboard shortcuts
A combination of keys that you can press to execute certain commands, as opposed to finding and clicking the commands' buttons on the Ribbon or elsewhere.

Excel Glossary
Live Preview
A feature in Excel 2007 that enables you to point to thumbnails on a drop-down gallery to see how a new font, font size, table style, or cell style would look on your selected data before you actually apply it.

Excel Glossary
macro
A series of commands or actions in Excel that are recorded and saved together in a file. You can run the macro whenever you need to perform the task.

Excel Glossary
Name box
The left-most section of the Formula bar that displays the address or name of the current cell.

Excel Glossary
pivot table
A special type of table unique to Excel 2007 that enables you to summarize large amounts of data and pivot or rearrange the table's data to display different summaries of the information it contains.

Excel Glossary
Ribbon
A new feature of the Excel 2007 interface that replaces the menus and toolbars of previous versions; appears at the top of the Excel window, just below the title bar.

Excel Glossary
ScreenTip
A small window that displays descriptive text when you point to but don't click a command on the Ribbon or other objects in a worksheet.

Excel Glossary
sheet tabs
Small tabs near the bottom of a worksheet that you click to move between the worksheets in a workbook. You can assign descriptive names to sheet tabs.

Excel Glossary
slicers
New graphic objects in Excel 2010 that enable you to quickly filter the contents of a PivotTable on more than one field.

Excel Glossary
SmartArt
A type of graphic object in Excel 2007 that gives you the ability to quickly and easily construct graphical lists and diagrams in the worksheet.

Excel Glossary
sparklines
Tiny graphs (miniature charts) that fit within a single cell in the worksheet, used to show basic trends in data.

Excel Glossary
Status bar
A horizontal bar that appears at the bottom of the Excel 2007 window and keeps you informed of Excel's current mode. In addition, you can use the Status bar to select a new worksheet view and to zoom in and out on the worksheet.

Excel Glossary
tabs
The various "pages" of Excel 2007's Ribbon interface that you click to display command buttons relating to the tab's name, such as Page Layout and Formulas.

Excel Glossary
template
A pre-designed worksheet that can be used as a basis for creating new worksheets.

Excel Glossary
WordArt
Stylized text objects that you use to add pizzazz and emphasis to headings and other text in Excel 2007 worksheets.

Excel Glossary
workbook
The basic file type that you create when you use Excel 2007. A new workbook consists of three worksheets by default.

Excel Glossary
worksheet
The main document that you work in when you enter data into cells within Excel 2007. A worksheet is stored in a workbook file.

Excel Glossary
worksheet area
The portion of an Excel 2007 worksheet in which you enter cell data and add objects such as charts and graphics.

Excel Glossary
XPS XML Paper Specification
A file format developed by Microsoft that enables people to open and print documents in XPS Reader without access to the original programs with which the documents were created (such as Excel).

Excel Glossary
Zoom slider
An object on the Status bar in Excel 2007 that enables you to increase the magnification in a worksheet or shrink it down to get an overall picture of the worksheet data.