With the Sampling tool that's part of the Data Analysis command in Excel, you can randomly select items from a data set or select every nth item from a data set. For example, suppose that as part of an internal audit, you want to randomly select five titles from a list of books. To do so, you could use the Sampling tool.
For purposes of this discussion, pretend that you’re going to use this list of books and book information.
To sample items from this worksheet, take the following steps:
To tell Excel that you want to sample data from a data set, first click the Data tab’s Data Analysis command button.
When Excel displays the Data Analysis dialog box, select Sampling from the list and then click OK.
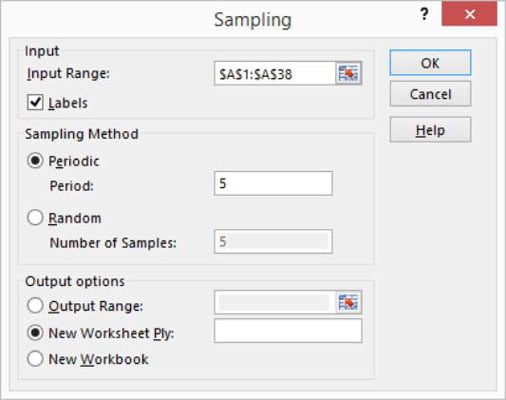
Excel displays the Sampling dialog box.
Identify the input range.
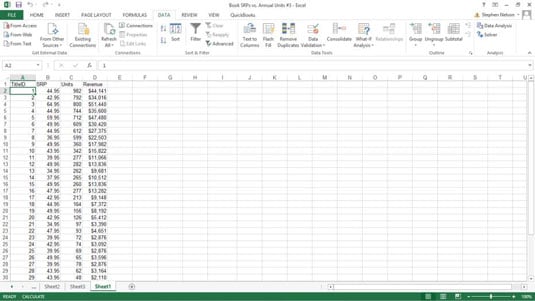
Use the Input Range text box to describe the worksheet range that contains enough data to identify the values in the data set. For example, in the case of the example data set, the information in column A — — uniquely identifies items in the data set.
Therefore, you can identify (or uniquely locate) items using the input range A1:A38. You can enter this range into the Input Range text box either by directly typing it or by clicking in the text box and then dragging the cursor from cell A1 to cell A38.
If the first cell in the input range holds the text label that describes the data — this is the case in the example data set — select the Labels check box.
Choose a sampling method.
Excel provides two sampling methods for retrieving or identifying items in your data set:
Periodic: A periodic sampling method grabs every nth item from the data set. For example, if you choose every fifth item, that’s periodic sampling. To select or indicate that you want to use periodic sampling, select the Periodic radio button. Then enter the period into its corresponding Period text box.
Random: To randomly choose items from the data set, select the Random radio button and then enter the number of items that you want in the Number of Samples text box.
Select an output area.
Select from the three radio buttons in the Output Options area to select where the sampling result should appear. To put sampling results into an output range in the current worksheet, select the Output Range radio button and then enter the output range into the text box provided.
To store the sampling information in a new worksheet or on a new workbook, select either the New Worksheet Ply or the New Workbook radio button.
Note that Excel grabs item information from the input range. For example, here is the information that Excel places on a new worksheet if you use periodic sampling and grab every fifth item.
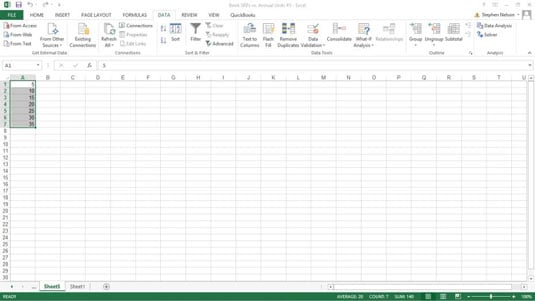
This is how Excel identifies the sample if you randomly select five items. Note that the values you see are the title ID numbers from the input range.