The income statement is the part of the financial report where you find out whether a company made a profit or took a loss. You also find information about the company's revenues, its sales levels, the costs it incurred to make those sales, and the expenses it paid to operate the business. These are the key parts of the statement:
Sales or revenues: How much money the business took in from its sales to customers.
Cost of goods sold: What it cost the company to produce or purchase the goods it sold.
Expenses: How much the company spent on advertising, administration, rent, salaries, and everything else that's involved in operating a business to support the sales process.
Net income or loss: The bottom line that tells you whether the company made a profit or operated at a loss.
The income statement is one of the three reports the Securities and Exchange Commission (SEC) and the Financial Accounting Standards Board (FASB) require. In fact, the FASB specifies that the income statement provide a report of comprehensive income, which means the report must reflect any changes to a company's equity during a given period of time that are caused by transactions, events, or other circumstances involving transactions with nonowner sources.
In simpler terms, this statement must reflect any changes in equity that aren't raised by investments from owners or distributed to owners.
When looking at an income statement, you can expect to find a report of either
Excess of revenues over expenses: This report means the company earned a profit.
Excess of expenses over revenues: This report means the company faced a loss.
Because the income statement shows profits and losses, some people like to call it the profit and loss statement (or P&L), but that isn't actually one of its official names. In addition to “statement of income,” the income statement has a number of official names that you may find in a financial report:
Statement of operations
Statement of earnings
Statement of operating results
Dig into dates
Income statements reflect an operating period, which means that they show results for a specific length of time. At the top of an income statement, you see the phrase “Years Ended” or “Fiscal Years Ended” and the month the period ended for an annual financial statement.
You may also see “Quarters Ended” or “Months Ended” for reports based on shorter periods of time. Companies are required to show at least three periods of data on their income statements, so if you're looking at a statement for 2012, you also find columns for 2011 and 2010.
Many people believe you need to analyze at least five years’ worth of data if you're thinking about investing. You can easily get hold of this data by ordering a two-year-old annual report along with the current one. You can also find most annual and quarterly reports online at a company's website or by visiting the SEC's Edgar website, which posts all financial reports filed with the SEC.
Because each report must have three years’ worth of data, a 2012 report shows data for 2011 and 2010, too. And a 2009 report shows 2008 and 2007 data also. So you actually have six years’ worth of data with these reports: 2012, 2011, 2010, 2009, 2008, and 2007.
Format
Not all income statements look alike. Basically, companies can choose to use one of two formats for the income statement: the single-step or the multistep.
Both formats give you the same bottom-line information. The key difference between them is whether they summarize that information to make analyzing it easier. The single-step format is easier to produce, but the multistep format gives you a number of subtotals throughout the statement that make analyzing a company's results easier. Most public corporations use the multistep format, but many smaller companies use the single-step format.
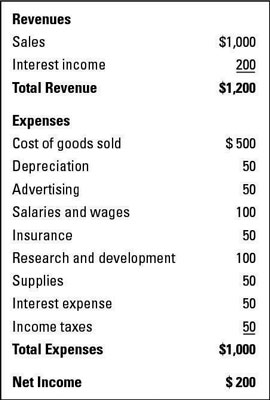
Single-step format
The single-step format groups all data into two categories: revenue and expenses. Revenue includes income from sales, interest income, and gains from sales of equipment. It also includes income that a company raises from its regular operations or from one-time transactions, such as from the sale of a building. Expenses include all the costs that are involved in bringing in the revenue.
The single-step format gets its name because you perform only one step to figure out a company's net income — you subtract the expenses from the revenue.
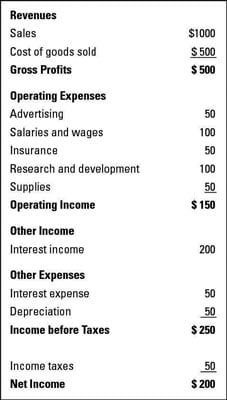
Multistep format
The multistep format divides the income statement into several sections and gives the reader some critical subtotals that make analyzing the data much easier and quicker. Even though the single-step and multistep income statements include the same revenue and expense information, they group the information differently. The key difference is that the multistep format has the following four profit lines:
Gross profit: This line reflects the profit generated from sales minus the cost of the goods sold.
Income from operations: This line reflects the operating income the company earned after subtracting all its operating expenses.
Income before taxes: This line reflects all income earned — which can include gains on equipment sales, interest revenue, and other revenue not generated by sales — before subtracting taxes or interest expenses.
Net income (or Net loss): This line reflects the bottom line — whether the company made a profit.
Many companies add even more profit lines, like earnings before interest, taxes, depreciation, and amortization, known as EBITDA for short.
Some companies that have discontinued operations include that information in the line item for continuing operations. But it’s better for the financial report reader if that information is on a separate line; otherwise, the reader doesn’t know what the actual profit or loss is from continuing operations.