Day traders to more than draw trend lines, technical analysts use their calculators — or have their software make calculations — to come up with different indicators, numbers used to gauge performance.
Pivot points
A pivot point is the average of the high, low, and close price for the day. If the next day’s price closes above the pivot point, that sets a new support level, and if the next day’s price is below the pivot point, that sets a new resistance level. Hence, calculating pivot points and how they change may indicate new upper and lower stops for your trading.
For markets that are open more or less continuously, such as foreign exchange, the close price is set arbitrarily. The usual custom in the United States is to use the price at 4 p.m. Eastern time, which is the closing time for the New York Stock Exchange.
Moving averages
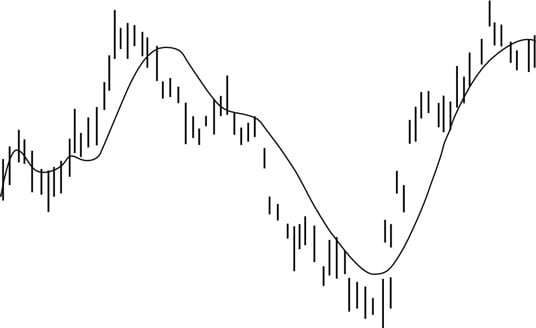
Looking at all those little high-low-open-close lines on a chart will give your bifocals a workout. To make trends easier to spot, traders calculate a moving average by averaging the closing prices for a given time period. Some prefer to look at the last 5 days, some at the last 60 days. Every day, the latest price is added, and the oldest price is dropped to make that day’s calculation.
Given the wonders of modern computing technology, pulling up moving averages for almost any time period you want is easy. The average for each day is then plotted against the price chart to show how the trend is changing over time.
Traders use the moving average line to look for crossovers, convergences, and divergences. A crossover occurs whenever the price crosses the moving average line. Usually, buying is a good idea when the price crosses above the moving average line, and selling is a good idea when the price crosses below it.
To use convergence and divergence in analysis, the trader looks at moving averages from different time periods, such as 5 days, 10 days, and 20 days.
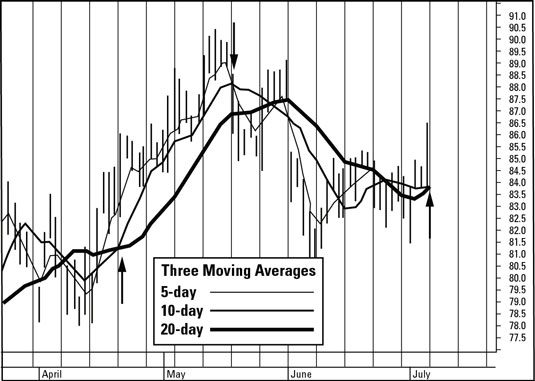
When two or three of the moving average lines converge (come together), that means that the trend may be ending. That often makes it a good time to buy if the trend has been down and a good time to sell if the trend has been up.
If two or three of the moving average lines split up and diverge, the trend is likely to continue. That means it’s probably a good time to buy if the trend is up and sell if the trend is down.
A moving average is a lagging indicator. It sums up trading activity in the last 5, 10, 30, or 60 days, which means that the line smooths out changes in the trend that may affect future prices, giving you a more accurate picture of the overall trend over the time period.