Several types of functions have graphs that can be directly manipulated on the TI-Nspire screen. To accomplish this task, simply press [CTRL][CLICK to grab the graph and then use the Touchpad keys to perform a transformation.
As an example, create the graph of y = x2. Two different options are possible:
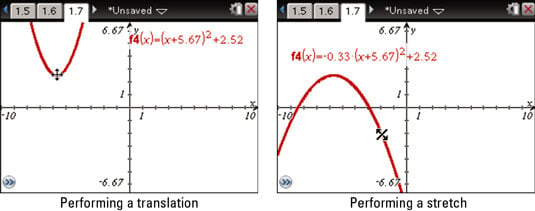
Perform a translation. Position the cursor on the vertex of the graph until the crossed, double-headed arrow symbol appears, and press [CTRL][CLICK] to grab the graph. Use the Touchpad keys to translate the graph and press [ESC] when finished.
Notice that the equation of the graph is updated automatically, in real time, as you move the graph, as shown in the first screen.
Perform a stretch. Position the cursor on a side of the parabola until the

symbol appears and press [CTRL][CLICK] to grab the graph. Use the Touchpad keys to stretch the graph and press [ESC] when complete.
Notice that the equation of the graph, specifically the value a in front of the parentheses, is automatically updated, as shown in the second screen.
Here is a list of the different functions that can be transformed using the same procedures just described:
Linear functions of the form y = b, where b is a constant
Linear functions of the form y = ax + b, where a and b are constants
Quadratic functions of the form y = ax2 + bx + c, where a, b, and c are constants or the form y = a(x – h)2 + k
Exponential functions of the form y = eax + b + c, where a, b, and c are constants
Exponential functions of the form y = beax + c, where a, b, and c are constants
Exponential functions of the form y = deax + b + c, where a, b, c, and d are constants
Logarithmic functions of the form y = a ln(cx + b) + d, where a, b, c, and d are constants
Sinusoidal functions of the form y = a sin(cx + b) + d, where a, b, c, and d are constants
Cosinusoidal functions of the form y = a cos(cx + b) + d, where a, b, c, and d are constants
All the previously mentioned functions can be translated and stretched. However, in the case of the first two linear functions, the stretch looks more like a rotation about the y-intercept.
With a bit of practice, you will quickly learn where to find the positions on the graph where the translation and stretch symbols appear. For example, translate the graph of a sin(cx + b) + d by positioning the cursor at a point halfway between the maximum and minimum values. Any other point on the graph, TI-Nspire allows you to stretch the graph.