


Press [MENU]→Graph Type→Parametric to switch to parametric graphing mode. Alternatively, move to the entry line and press [CTRL][MENU]→Parametric. Next, follow these steps:
Type the x-component equation, using t as the independent variable.
TI-Nspire uses the notation x1(t) for the first x-component, x2(t) for the second x-component, and so on.
Type the y-component equation, using t as the independent variable.
TI-Nspire uses the notation y1(t) for the first y-component, y2(t) for the second y-component, and so on.
Edit the interval for the variable t and the tstep increment.
By default, parametric graphing is configured in radians with

Press [ENTER] to graph the parametric curve.
Here is an example of a parametric graph.
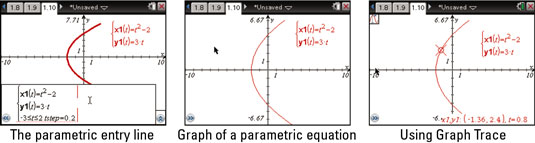
In the second screen, pressing [CTRL][G] hides the entry line.
The third screen uses Graph Trace (press [MENU]→Trace→Graph Trace) to trace along the graph. Each time you press
or
the trace moves by a value of t equal to t-step.
Many of the features of function graphing (for example, changing attributes, adding a function table, or adding geometric objects to a parametric graph) are available in parametric graphing mode.

