


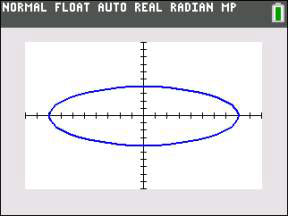
Anything that can be graphed in Function mode on the TI-84 Plus an also be graphed as a set of parametric equations. Using parametric equations enables you to investigate horizontal distance, x, and vertical distance, y, with respect to time, T. This adds a new dimension to your graph!
Setting the window
Setting the window in Parametric mode is a crucial step in graphing parametric equations. In fact, if my students are having trouble graphing parametric equations, it is usually because of the way they have set up their window. Specifically, three window settings tend to cause problems: Tmin, Tmax, and Tstep.
The interval for T is given in the problem
So, identifying Tmin and Tmax is pretty easy for this problem. This is going to sound strange, but changing the minimum and maximum values of T doesn't affect the viewing window of your graph. You would have to change the minimum and maximum values of X and Y to change the graphing window.
What do the T values affect? The maximum and minimum T values affect how much of the graph you see. In Function mode, piecewise functions have a restricted domain so that you can only see a "piece" of the function. In Parametric mode, the T values can be restricted, which can make it difficult to predict what the "whole" graph would look like if the T values were not restricted to a certain interval.
How do you decide the size of Tstep? Tstep is the increment that your graph uses to plot each point in creating the graph you see on the screen. As a general rule of thumb, the smaller your step is, the more accurate your graph is going to be.
The drawback is as the step gets smaller, your calculator takes longer to graph your parametric equations. As a general rule of thumb, the default value of the TStep is usually a good balance between graph accuracy and the time it takes to graph.
Here are the steps to set your graphing window:
Press [WINDOW] to access the window editor.
See the first screen.

Change the value of Tmin and Tmax.
See the second screen.
Press [ENTER].
Notice, pressing [ENTER] evaluates 2π and the approximate value of 6.283185307 is displayed. See the third screen.
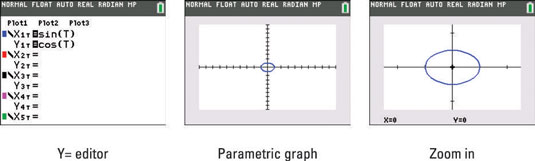
Graphing parametric equations
You have done all the heavy lifting; this step is easy. Before you press [GRAPH], make sure you watch the direction that your graph is created. Your calculator begins graphing by substituting the smallest T value in the interval. If your Tstep is small enough, you should be able to see the graph develop.
Press [GRAPH].
Using Zoom to change the window
If the graphing window is not to your liking, you can use any of the Zoom commands. For example, if you are graphing the parametric equations shown in the first screen, you may not be happy with the graphing window shown in the second screen. Press [ZOOM][2][ENTER] to zoom in as illustrated in the third screen.
Using Trace to evaluate a parametric equation
You are going to love using the Trace feature to evaluate parametric equations. A lot of information fits in the graph border around the graph screen. Remember, you are not tracing x-values as you do in Function mode. Follow these steps to evaluate a function at specific T values:
Press [TRACE].
See the first screen. Your trace starts at the smallest T value in the interval defined in the Window editor. The values of X, Y, and T are all displayed in the border at the bottom of your graph screen.
The TI-84 Plus C displays functions and information in the border of the graph screen. The TI-84 Plus displays similar information directly on the graph screen.

Press the right-arrow key to find the direction of motion of the parametric equations.
Pay attention to the direction of motion as you increase the value of T.
Enter a specific T value.
After pressing [TRACE], entering a number opens up an entry line in the border at the bottom of your graph screen, as shown in the second screen.
Press [ENTER].
See the result as shown in the third screen.
Viewing the table of a parametric graph
It is easy to view the values of X, Y, and T all in one table. Press [2nd][GRAPH] to view the table as shown in the first screen.
Read the Context Help in the border at the top of the table. To change the table increment, press [+] and edit the value at the bottom of the screen as shown in the second screen.
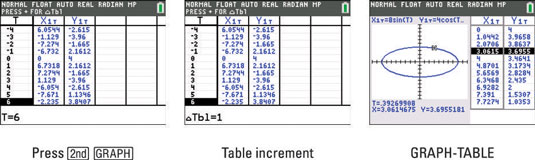
Another option is to show a split screen with a graph and a table. Press [MODE], use the arrow keys to highlight GRAPH-TABLE and press [ENTER]. Press [GRAPH] to see the split screen. Using Trace in the Graph-Table mode automatically highlights the ordered pairs in the table, as shown in the third screen.

