When you graph conic sections on the polar plane, you use equations that depend on a special value known as eccentricity, which describes the overall shape of a conic section. The value of a conic's eccentricity can tell you what type of conic section the equation describes, as well as how fat or skinny it is.
When graphing equations in polar coordinates, you may have trouble telling which conic section you should be graphing based solely on the equation (unlike graphing in Cartesian coordinates, where each conic section has its own unique equation). Therefore, you can use the eccentricity of a conic section to find out exactly which type of curve you should be graphing.
Here are the two equations that allow you to put conic sections in polar coordinate form, where (r, theta) is the coordinate of a point on the curve in polar form. Recall that r is the radius, and theta is the angle in standard position on the polar coordinate plane.
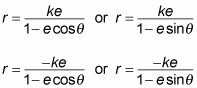
When graphing conic sections in polar form, you can plug in various values of theta to get the graph of the curve. In each equation above, k is a constant value, theta takes the place of time, and e is the eccentricity. The variable e determines the conic section:
If e = 0, the conic section is a circle.
If 0 < e < 1, the conic section is an ellipse.
If e = 1, the conic section is a parabola.
If e > 1, the conic section is a hyperbola.
For example, say you want to graph this equation:
The first thing you need to do is make the denominator begin with 1. This denominator begins with 4, so you have to factor out that 4 to find out what k is!
Factoring out the 4 from the denominator gives you [
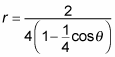
In order to keep the equation close to the standard form for polar conics, multiply the numerator and denominator by 1/4. This step gives you

Therefore, the constant k is 1/2 and the eccentricity, e, is 1/4, which tells you that you have an ellipse because e is between 0 and 1.
In order to graph the polar function of this ellipse, you can plug in values of theta and solve for r. Then plot the coordinates of (r, theta) on the polar coordinate plane to get the graph. For the graph of the example equation,
you can plug in
and find r in each case:
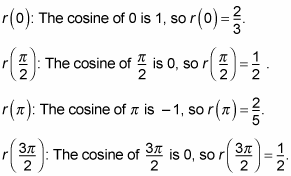
These four points are enough to give you a rough sketch of the graph.
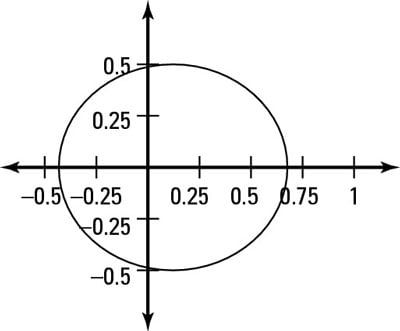
You can see the graph of the example ellipse in this figure.