You can graph a scatter plot of your data on the TI-Nspire; you can collect data automatically or manually. If you are ready to configure a scatter plot of already entered data, here’s what you need to do:
Move back to the Geometry page and press [TAB] to activate the entry line (as indicated by a blinking cursor located next to the first available function).
Press [MENU]→Graph Type→Scatter Plot to switch the entry line to scatter plot. Alternatively, press [CTRL][MENU]→Scatter Plot while the cursor is located in the entry line.
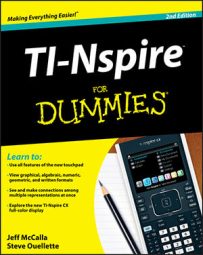
Here, [VAR] is pressed to view a list of choices for the x-variable.
Using the

keys, highlight length_ and press [CLICK] or [ENTER].
Press [TAB] to move to the y-variable, press [VAR] to view a list of choices for the y-variable, highlight area_, and press [CLICK] or [ENTER].
You may need to adjust your window settings (press [MENU]→Window→Window Settings) to view the captured data.
How to collect data automatically on TI-Nspire
To capture data automatically, just drag the object that changes the values of your stored variables. In this activity, manipulating the rectangle changes both the length and area measurements. Consequently, these updated measurements are periodically dropped into the Lists & Spreadsheet application and plotted in the coordinate plane at the same time.
Recall that when you constructed the rectangle, you defined three vertices. You can drag the third vertex of the rectangle (or the fourth vertex that was never defined) to change the size of the rectangle. You might want to change the attributes of the movable points to Empty Large. Remember that the perimeter has been locked, which adds the constraint that the perimeter must remain fixed at all times.
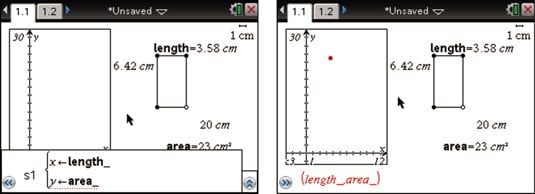
Move the cursor to an appropriate vertex of the rectangle and press [CTRL][CLICK] to grab it. Resize the rectangle using the arrow keys on the Touchpad. As shown in the first two screens, a scatter plot of the area versus length data automatically appears. The third screen shows the corresponding numerical data on the Lists & Spreadsheet page.
You may be tempted to drag the rectangle back and forth many times. Remember, each time you manipulate the rectangle, you are adding more points to the lists. Too much of a good thing is possible, at least when it comes to data.
How to manually capture data on TI-Nspire
With the Manual Data Capture feature, data is only captured each time you press [CTRL][.] from within any application in the problem. Manual data capture is helpful if you want to limit the amount of data that is captured. Use manual data capture with this activity to get students to think about which pieces of data are important to collect.
The steps for configuring TI-Nspire for manual data capture are identical to those described for automatically capturing data, with one small exception. Press [MENU]→Data→Data Capture and select Manual Data Capture rather than Automatic Data Capture.
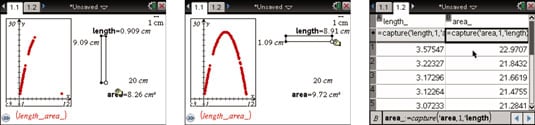
If you configured the Lists & Spreadsheet page for manual data capture, move to the Geometry page and grab and drag the rectangle. Periodically, press [CTRL][.] to capture another data point. Here is a typical sequence of results from using the Manual Data Capture feature. You can capture as many points as you want. Just make sure that you capture enough to reveal the general shape of the graph as well as the location of the length value that produces a maximum area.
How to repeat a data capture on TI-Nspire
Sometimes you want to repeat an experiment. To do this, just move to the Lists & Spreadsheet page and highlight the formula cell for column A. Press [ENTER] twice to clear the data in the first column while preserving the Data Capture command that you spent so much time configuring. Repeat this procedure to clear the data in column B. Now you are ready to go to the Geometry page and repeat the experiment.