You can use your TI-84 Plus to graph residual plots. A residual plot shows the residuals on the vertical axis and the independent variable on the horizontal axis.
What are residuals? Residuals are a sum of deviations from the regression line. Because a linear regression is not always the best choice, residuals help you figure out if your regression model is a good fit for your data. Here are the steps to graph a residual plot:
Press [Y=] and deselect stat plots and functions.
To remove the highlight from a plot so that it won’t be graphed, use the

keys to place the cursor on the Plot and then press [ENTER].
To remove the highlight from an equal sign, use the arrow keys to place the cursor on the equal sign in the definition of the function, and then press [ENTER].
Press [2nd][Y=][2] to access Stat Plot2 and enter the Xlist you used in your regression.
Enter the Ylist by pressing [2nd][STAT] and using the up- and down-arrow keys to scroll to RESID.
See the first screen.
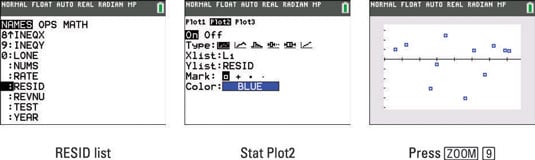
Press [ENTER] to insert the RESID list.
See the second screen.
Press [ZOOM][9] to graph the residual plot.
See the third screen.