The mathematical definition of a hyperbola is the set of all points where the difference in the distance from two fixed points (called the foci) is constant.
There are two kinds of hyperbolas: horizontal and vertical.
The equation for a horizontal hyperbola is
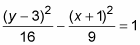
The equation for a vertical hyperbola is
Notice that x and y switch places (as well as the h and v with them) to name horizontal versus vertical, compared to ellipses, but a and b stay put. So, for hyperbolas, a-squared should always come first, but it isn’t necessarily greater. More accurately, a is always squared under the positive term (either x-squared or y-squared). Basically, to get a hyperbola into standard form, you need to be sure that the positive squared term is first.
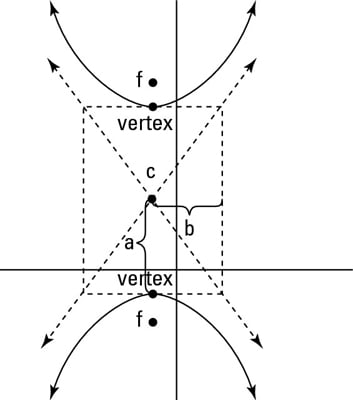
The center of a hyperbola is not actually on the curve itself, but exactly in between the two vertices of the hyperbola. Always plot the center first, and then count out from the center to find the vertices, axes, and asymptotes.
A hyperbola has two axes of symmetry. The one that passes through the center and the two foci is called the transverse axis; the one that’s perpendicular to the transverse axis through the center is called the conjugate axis. A horizontal hyperbola has its transverse axis at y = v and its conjugate axis at x = h; a vertical hyperbola has its transverse axis at x = h and its conjugate axis at y = v.
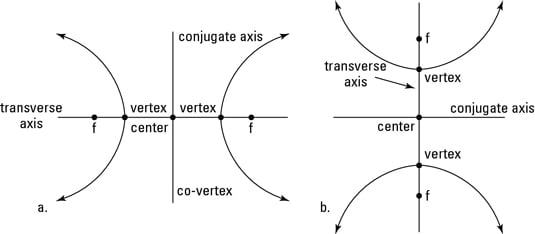
You can see the two types of hyperbolas in the above figure: a horizontal hyperbola on the left, and a vertical one on the right.
If the hyperbola that you are trying to graph is not in standard form, then you need to complete the square to get it into standard form.
For example, the equation
is a vertical hyperbola. The center (h, v) is (–1, 3).
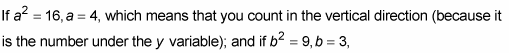
(which means that you count horizontally 3 units from the center both to the left and to the right). The distance from the center to the edge of the rectangle marked “a” determines half the length of the transverse axis, and the distance to the edge of the rectangle marked “b” determines the conjugate axis.
In a hyperbola, a could be greater than, less than, or equal to b. If you count out a units from the center along the transverse axis, and b units from the center in both directions along the conjugate axis, these four points will be the midpoints of the sides of a very important rectangle. This rectangle has sides that are parallel to the x- and y-axis (in other words, don’t just connect the four points because they are the midpoints of the sides, not the corners of the rectangle). This rectangle will be a useful guide when it is time to graph the hyperbola.
But as you can see in the above figure, hyperbolas contain other important parts that you must consider. For instance, a hyperbola has two vertices. There are two different equations — one for horizontal and one for vertical hyperbolas:
-
A horizontal hyperbola has vertices at (h ± a, v).
-
A vertical hyperbola has vertices at (h, v ± a).
You find the foci of any hyperbola by using the equation
where F is the distance from the center to the foci along the transverse axis, the same axis that the vertices are on. The distance F moves in the same direction as a. Continuing this example,
To name the foci as points in a horizontal hyperbola, you use (h ± F, v); to name them in a vertical hyperbola, you use (h, v ± F). The foci in the example would be (–1, 3 ± 5), or (–1, 8) and (–1, –2). Note that this places them inside the hyperbola.
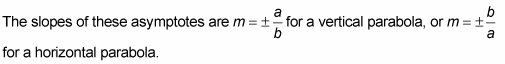
Through the center of the hyperbola run the asymptotes of the hyperbola. These asymptotes help guide your sketch of the curves because the curves cannot cross them at any point on the graph.
To graph a hyperbola, follow these simple steps:
-
Mark the center.
Sticking with the example hyperbola
You find that the center of this hyperbola is (–1, 3). Remember to switch the signs of the numbers inside the parentheses, and also remember that h is inside the parentheses with x, and v is inside the parentheses with y. For this example, the quantity with y-squared comes first, but that does not mean that h and v switch places. The h and v always remain true to their respective variables, x and y.
-
From the center in Step 1, find the transverse and conjugate axes.
Go up and down the transverse axis a distance of 4 (because 4 is under y), and then go right and left 3 (because 3 is under x). But don’t connect the dots to get an ellipse! Up until now, the steps of drawing a hyperbola were exactly the same as when you drew an ellipse, but here is where things get different. The points you marked as a (on the transverse axis) are your vertices.
-
Use these points to draw a rectangle that will help guide the shape of your hyperbola.
Because you went up and down 4, the height of your rectangle is 8; going left and right 3 gives you a width of 6.
-
Draw diagonal lines through the center and the corners of the rectangle that extend beyond the rectangle.
This gives you two lines that will be your asymptotes.
-
Sketch the curves.
Draw the curves, beginning at each vertex separately, that hug the asymptotes the farther away from the vertices the curve gets.
The graph approaches the asymptotes but never actually touches them. The above figure shows the finished hyperbola.