
When to trade a stock is the million dollar question. A stock can transition from a downtrend to an uptrend in several different ways. It can, for example, fall precipitously, turn on a dime, and begin heading higher. Although turning on a dime from downtrending to upward trending sometimes presents profitable trading opportunities, these transitions are difficult to identify and are even more difficult to base a trade on.
Cup and handle formation
Another widely followed transitional formation is called a cup and handle. In a cup and handle formation, a stock’s price levels form a rounded curving bottom that looks a bit like a cup or a saucer, which often is followed by a modest shakeout formation that, if you use your imagination, looks a bit like the handle on a coffee cup.
The Apple, Inc., stock (AAPL) illustrates the cup and handle formation.
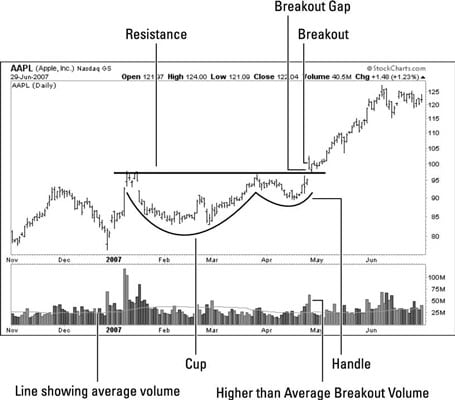
The entry strategy for this pattern is similar to that used for the trading range breakout. The trigger occurs when the stock price breaks above the handle on high volume. In the Apple example, it occurs in late April and is accompanied by a small breakout gap.
Notice that the stock traded in a very narrow range during the next couple of days, retesting the former area of resistance. As often is the case, that former resistance level actually provided support after it was crossed. You’ll see this phenomenon occur frequently.
The cup and handle is a reliable trading pattern, but that doesn’t mean the pattern never fails. It does, and you need an exit strategy for when it does, just like every other trade.
What to do with a double bottom
Another transition pattern that often leads to profitable trading opportunities is the double bottom. Visually, a double bottom looks like a W on the chart, so it is very easy to see. However, a double bottom doesn’t need to form a perfect W to be valid.
In fact, many traders actually prefer the right-hand trough to be a little lower than the left-hand trough. When a minor new low forms, it tends to shake out the weakest owners of the stock and makes it much easier for bulls to drive the price higher.
Here is a well-formed double bottom on the Newmont Mining Corp. (NEM) stock chart. The left-hand trough occurred in June 2007; the right-hand trough in August 2007.
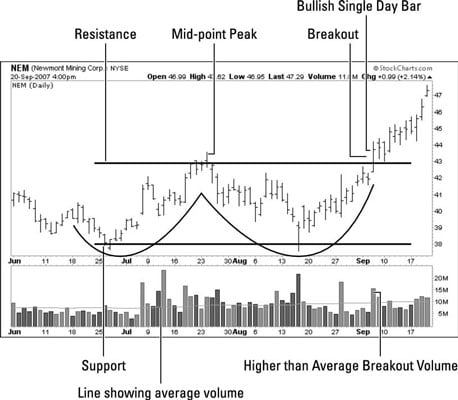
The entry criteria for this pattern are similar to that of the trading-range breakout. In this case, the trigger point occurs when the stock breaks above the mid-point peak between the two troughs. This peak is sometimes called the pivot point. Ideally, higher-than-average volume confirms the trigger.
The trigger price on the chart is just below $43.00, which corresponds to the $42.91 close on July 24. The stock gapped above the trigger point on September 6 with a volume of more than 15 million shares. That’s 50 percent more than the average daily trading volume.
Also notice the bullish single-day bar pattern on the breakout. The stock pulled back to test resistance at the mid-point close price and then rallied.
An alternative double-bottom strategy
One scenario where aggressive traders may want to anticipate the formation of a double-bottom pattern is when the “W” is particularly deep and the pivot is many points away from the trough. When that happens, taking a position as the stock is forming the right-hand trough sometimes makes sense.
If the price holds near or just below the left-hand trough and volume confirms the reversal, then aggressive traders can enter a position. You may also want to enter a position if signals from other single-day patterns confirm the reversal.
The risk is relatively small, and the potential reward is relatively large. If the stock falls below the lowest low, you’ll know your trade has failed and you must exit. Otherwise, hold the position until the stock tests the pivot point.
Using the NEM chart to illustrate this strategy, the buy trigger occurred on August 16 when NEM showed the single-day reversal pattern at the bottom of the trough. Your entry point would be the next trading day, and your stop would be below $37.60, the low for that reversal bar.
Other patterns
Many other reversal patterns are published in technical analysis books and magazines, but be careful when determining which are the most reliable.
Inexperienced traders always want to find the Holy Grail, that pattern or indicator that enables them to profitably trade the turn-on-a-dime V pattern. In truth, however, V bottoms don’t happen all that often. And when they do, many reasons express why it’s probably not the best trading opportunity available to you.
If you talk shop with other traders, you’re certain to hear them discuss many esoteric patterns. Experienced traders rarely trade on these patterns. There’s no need to look for the obscure when the simple does the job just as well.