How to Evaluate Scenarios with Excel 2010's Scenario Manager
Excel 2010's Scenario Manager enables you to create and save sets of different input values that produce different calculated results as named scenarios (such as Best Case, Worst Case, and Most Likely Case). The key to creating the various scenarios for a table is to identify the various cells in the data whose values can vary in each scenario. You then select these cells (known as changing cells) in the worksheet before you open the Scenario Manager dialog box.
The steps below follow a specific example for using Scenario Manager to help you understand how to use this feature. The figure shows a Sales Forecast table after selecting the three changing cells in the worksheet — H3 named Sales_Growth, H4 named COGS (Cost of Goods Sold), and H6 named Expenses — and then opening the Scenario Manager dialog box.
The example uses three scenarios based on the following sets of values for the three changing cells:
Most Likely, where the Sales_Growth percentage is 5%, COGS is 20%, and Expenses is 25%
Best Case, where the Sales_Growth percentage is 8%, COGS is 18%, and Expenses is 20%
Worst Case, where the Sales_Growth percentage is 2%, COGS is 25%, and Expenses is 35%

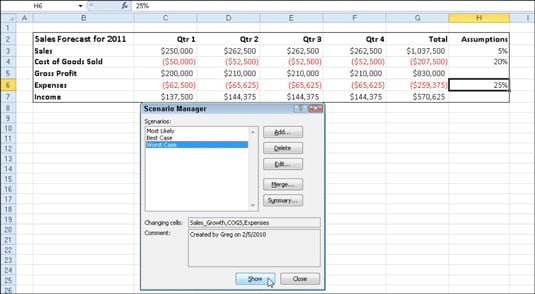
Use the Scenario Manager to add and switch to different scenarios in your worksheet.
Follow these steps to use the Scenario Manager:
On the Data tab of the Ribbon, choose What-If Analysis→Scenario Manager in the Data Tools group.
The Scenario Manager dialog box appears.
To create a scenario, click the Add button.
The Add Scenario dialog box appears.

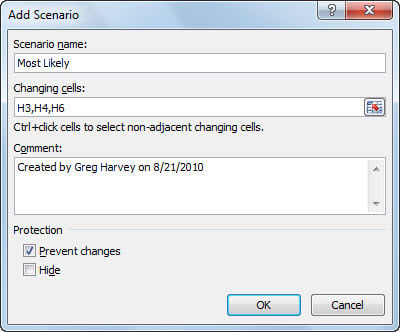
Create a scenario in the Add Scenario dialog box.
Type the name of the scenario (Most Likely, in this example) in the Scenario Name text box, specify the Changing Cells (if they weren't previously selected), and click OK.
Excel displays the Scenario Values dialog box.
Enter the values for each of the changing cells in the text boxes.
In this example, you would enter the following values for the Most Likely Case scenario:
0.05 in the Sales_Growth text box
0.20 in the COGS text box
0.25 in the Expenses text box
Click the Add button.
Excel redisplays the Add Scenario dialog box.
Repeat Steps 3 through 5 to enter the other scenarios. When you finish entering values for the final scenario, click OK instead of Add.
The Scenario Manager dialog box makes another appearance, this time displaying the names of all scenarios in its Scenarios list box.
To have Excel plug the changing values from any scenario into the table, click the scenario name in the Scenarios list box and then click Show.
Click the Close button when you're finished with the Scenario Manager.
After adding the various scenarios for a table in your worksheet, don't forget to save the workbook. That way, you'll have access to the various scenarios each time you open the workbook in Excel by opening the Scenario Manager, selecting the scenario name, and clicking the Show button.

Excel Glossary
active cell
The worksheet cell that contains the cell cursor. Each worksheet can have only one active cell.

Excel Glossary
AutoComplete
A feature that looks at the entries that you make in a worksheet column and automatically duplicates them in subsequent rows whenever you start a new entry that begins with the same letter or letters as an existing entry in that column.

Excel Glossary
AutoCorrect
A feature that alerts Excel 2007 to common typing errors and your own typing errors (that you specify) and tells the program how it should automatically fix them for you.

Excel Glossary
AutoFill
An Excel 2007 feature that quickly creates a series of entries based on the data you enter in one or two cells. AutoFill works with days of the week, months of the year, yearly quarters; consecutive series of numbers; and formulas. You also can add your own custom AutoFill series.

Excel Glossary
AutoFilter
A feature in Excel 2010 that enables you to temporarily hide everything in a table except the records you specifically want to view, based on criteria you specify.

Excel Glossary
Backstage view
A new feature in Excel 2010 — accessible from the green File tab — that enables you to manage files and to view the properties and stats about the workbook file you're editing.

Excel Glossary
cell
The intersection of a column and row in the worksheet.

Excel Glossary
cell address
The cell identifier, determined by its column letter(s) followed by the row number, as in cell A1, the very first cell of each worksheet at the intersection of column A and row 1.

Excel Glossary
cell cursor
The black border that surrounds the active cell in a worksheet.

Excel Glossary
clip art
Readymade drawings, illustrations, and photos offered by Microsoft for use in Microsoft Office applications.

Excel Glossary
Compatibility Checker
A utility in Excel 2007 and 2010 that you use to find potential compatibility issues if you plan to save an Excel workbook file in the older Excel 97–2003 file format.

Excel Glossary
current cell
The worksheet cell that contains the cell cursor. Each worksheet can have only one current cell.

Excel Glossary
data table
A range of cells in a worksheet in which you enter a series of possible values that Excel plugs into a formula so you can perform what-if analysis on the data.

Excel Glossary
dialog box
A rectangular window with settings and commands that appears when you click a dialog box launcher or certain other commands on the Ribbon.

Excel Glossary
dialog box launcher
A small icon in the lower-right corner of a group of command buttons on the Ribbon that you click to access a dialog box with additional related settings and commands.

Excel Glossary
function
A part of a formula that takes a number of specific arguments and then returns a single value based on those arguments.

Excel Glossary
gallery
A drop-down list of thumbnail selections that appears when you click certain command buttons on the Ribbon.

Excel Glossary
group
A section of a tab on the Excel 2007 Ribbon that organizes related command buttons into subtasks normally performed as part of the tab's larger core task. The name of a group appears at the bottom of the group, such as the Font group on the Home tab.

Excel Glossary
hyperlink
Specially formatted text that anyone can click to jump to Web sites, move to other cells or workbooks, or create an e-mail message.

Excel Glossary
keyboard shortcuts
A combination of keys that you can press to execute certain commands, as opposed to finding and clicking the commands' buttons on the Ribbon or elsewhere.

Excel Glossary
Live Preview
A feature in Excel 2007 that enables you to point to thumbnails on a drop-down gallery to see how a new font, font size, table style, or cell style would look on your selected data before you actually apply it.

Excel Glossary
macro
A series of commands or actions in Excel that are recorded and saved together in a file. You can run the macro whenever you need to perform the task.

Excel Glossary
Name box
The left-most section of the Formula bar that displays the address or name of the current cell.

Excel Glossary
pivot table
A special type of table unique to Excel 2007 that enables you to summarize large amounts of data and pivot or rearrange the table's data to display different summaries of the information it contains.

Excel Glossary
Ribbon
A new feature of the Excel 2007 interface that replaces the menus and toolbars of previous versions; appears at the top of the Excel window, just below the title bar.

Excel Glossary
ScreenTip
A small window that displays descriptive text when you point to but don't click a command on the Ribbon or other objects in a worksheet.

Excel Glossary
sheet tabs
Small tabs near the bottom of a worksheet that you click to move between the worksheets in a workbook. You can assign descriptive names to sheet tabs.

Excel Glossary
slicers
New graphic objects in Excel 2010 that enable you to quickly filter the contents of a PivotTable on more than one field.

Excel Glossary
SmartArt
A type of graphic object in Excel 2007 that gives you the ability to quickly and easily construct graphical lists and diagrams in the worksheet.

Excel Glossary
sparklines
Tiny graphs (miniature charts) that fit within a single cell in the worksheet, used to show basic trends in data.

Excel Glossary
Status bar
A horizontal bar that appears at the bottom of the Excel 2007 window and keeps you informed of Excel's current mode. In addition, you can use the Status bar to select a new worksheet view and to zoom in and out on the worksheet.

Excel Glossary
tabs
The various "pages" of Excel 2007's Ribbon interface that you click to display command buttons relating to the tab's name, such as Page Layout and Formulas.

Excel Glossary
template
A pre-designed worksheet that can be used as a basis for creating new worksheets.

Excel Glossary
WordArt
Stylized text objects that you use to add pizzazz and emphasis to headings and other text in Excel 2007 worksheets.

Excel Glossary
workbook
The basic file type that you create when you use Excel 2007. A new workbook consists of three worksheets by default.

Excel Glossary
worksheet
The main document that you work in when you enter data into cells within Excel 2007. A worksheet is stored in a workbook file.

Excel Glossary
worksheet area
The portion of an Excel 2007 worksheet in which you enter cell data and add objects such as charts and graphics.

Excel Glossary
XPS XML Paper Specification
A file format developed by Microsoft that enables people to open and print documents in XPS Reader without access to the original programs with which the documents were created (such as Excel).

Excel Glossary
Zoom slider
An object on the Status bar in Excel 2007 that enables you to increase the magnification in a worksheet or shrink it down to get an overall picture of the worksheet data.