A behavior chart graphically shows how variation plays out over time in a Six Sigma initiative. Time/order can be a critical factor, especially when you’re trying to figure out the causes behind variation and changes in process behavior. Under normal conditions, a process or characteristic should behave normally. This statement is more profound than it sounds. The performance of every process or characteristic has natural variation.
To investigate the behavior of a characteristic or process, plot your observed measurements one at a time along an axis representing time or order, in the exact sequence the measurements occurred in real life.
To create a characteristic or process behavior chart, follow these steps:
Create a horizontal scale representing time or order.
You usually do so by creating an axis for the order in which the measurements occurred, called their run order.
Create a vertical axis representing the scale of measure for the characteristic.
This scale can be in millimeters for length, pounds for weight, minutes for time, number of defects found on an inspected part, or anything else that quantifies what aspect of the characteristic you’re interested in.
Set the maximum and minimum values on this vertical scale just slightly larger and slightly lower than the maximum and minimum observed data values, respectively. That way, you won’t have some of your process data disappearing off the edge of your chart.
Plot each observation as a dot, using its order and measurement.
Connect the dots.
Draw a line between each sequential point to emphasize the change that occurs between observations.
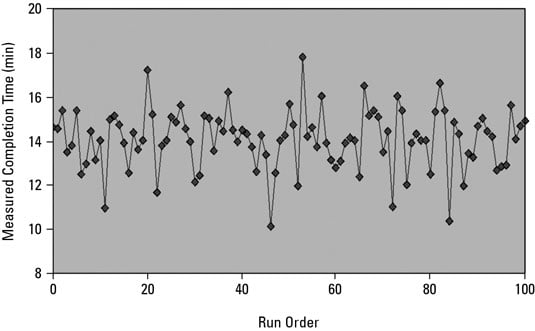
Review the behavior chart for the completion time of an assembly process.
A behavior chart not only allows you to see the normal behavior of a process or characteristic but also lets you quickly detect non-normal behavior — variation above and beyond the expected normal level. The causes of non-normal behavior are the assignable or special causes that erode and degrade entitlement performance over the long term. Behavior charts form the foundation of detecting and finding the root cause of non-normal behavior.
A process or characteristic has variation that bounces around a central, horizontal level on the behavior chart. Most of the observed variation clusters close to this central level. However, every now and then you see values that are farther away from the center. The variation of these exceptions is completely random over time, without patterns or trends.
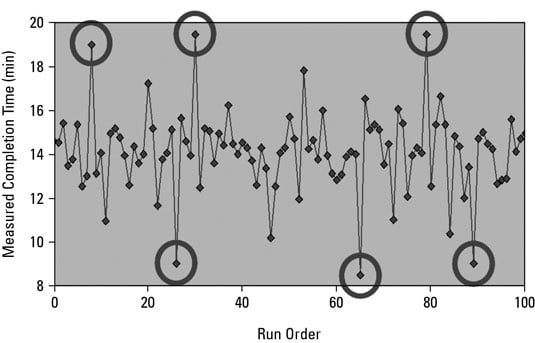
Variation beyond expected limits
Outliers are measurement observations that occur beyond the limits of the normal short-term variation you expect out of the process or characteristic.
Observing an outlier is like rolling five doubles in a row with a pair of dice. Five doubles in a row is possible but not common; when that roll happens, you suspect that something out of the ordinary is at play, such as maybe a loaded pair of dice.
This behavior chart has variation outside the expected levels.
When you see such excessive, non-normal variation, use the time scale or run order of the behavior chart as a starting point for investigating what conditions or factors are at fault. What was different at that point in time to take the characteristic or process behavior out of its normal course? The answer allows you to identify and manage the factor or factors influencing the process or characteristic performance.
Typical causes of outliers include worker inattention, measurement errors, and other one-time changes to the process’s or characteristic’s environment. You may have a data outlier for purchase order processing due to an emergency in the office where two workers had to leave at the same time, or a purchase order in the queue for an excessive period of time because no one was around to take care of it.
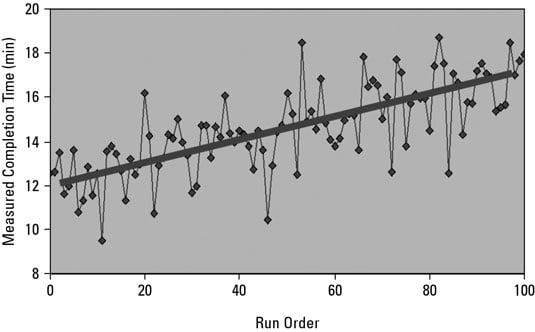
Trends
A trend is a steady, gradual increase or decrease in the central tendency of the process or characteristic as it plays out over time. If all the conditions in the system stay constant, the level of performance of the process or characteristic also stays level.
The presence of a trend in a graphical behavior plot is evidence that something out of the ordinary has happened to move the location of the process or characteristic behavior. Below is a sample of a trend in the location of the variation center over time in a process behavior chart.
Just like with any other evidence of non-normal behavior, when you see a trend in a behavior chart, you need to look more closely at the system to uncover what is causing the changed performance.
Trends in performance are almost always caused by system factors that gradually change over time, such as temperature, tool wear, machine maintenance, rising costs, and so on.
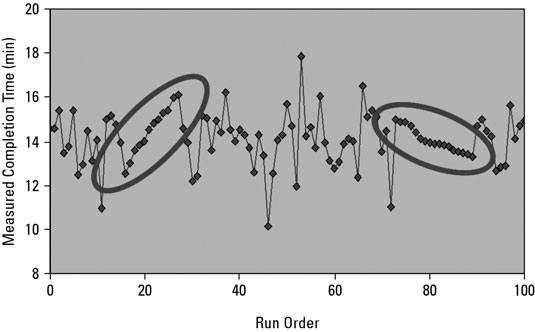
Runs
A run is a sequence of consecutive observations that are each increasingly larger or smaller than the previous observation. Here’s an example of two runs, one increasing and one decreasing, within a behavior chart. Runs can be caused by faulty equipment, calibration issues, and cumulative effects, among other things.
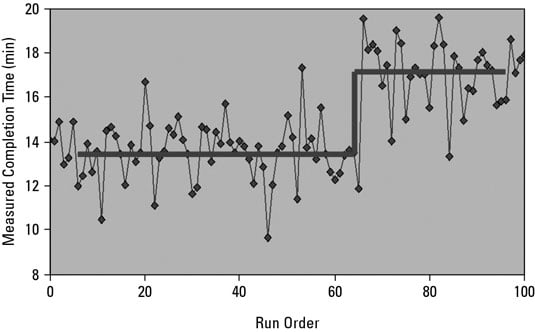
Shifts
Shifts are sudden jumps, up or down, in the process’s or characteristic’s center of variation. Something in the system changes permanently — a piece of equipment, a new operator, a change in material, a new procedure, or whatever — to cause these modifications. Shifts are clearly non-normal behavior.
This process or characteristic has experienced a shift in the center level of its variation.