


For example, you may want to compare the difference in average age of Republicans versus Democrats, or the difference in average incomes of men versus women. You estimate the difference between two population means,
![]()
by taking a sample from each population (say, sample 1 and sample 2) and using the difference of the two sample means
![]()
plus or minus a margin of error. The result is a confidence interval for the difference of two population means,
![]()
There are two situations where you cannot use z* when computing the confidence interval. The first of which is if you not know
![]()
In this case you need to estimate them with the sample standard deviations, s1 and s2. The second situation is when the sample sizes are small (less than 30). In this case you can’t be sure whether your data came from a normal distribution.
In either of these situations, a confidence interval for the difference in the two population means is

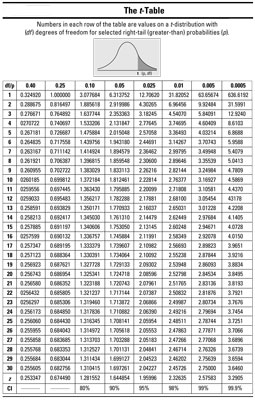
where t* is the critical value from the t-distribution with n1 + n2 – 2 degrees of freedom; n1 and n2 are the two sample sizes, respectively; and s1 and s2 are the two sample standard deviations. This t*-value is found on the following t-table by intersecting the row for df = n1 + n2 – 2 with the column for the confidence level you need, as indicated by looking at the last row of the table.
To calculate a CI for the difference between two population means, do the following:
-
Determine the confidence level and degrees of freedom (n1 + n2 – 2) and find the appropriate t*-value.
Refer to the above table.
-
Identify

Identify

-
Find the difference,

between the sample means.
-
Calculate the confidence interval using the equation,

-
To calculate the CI, you first need to find the t*-value on the t-distribution with (15 + 15 – 2) = 28 degrees of freedom. Using the above t-table, you look at the row for 28 degrees of freedom and the column representing a confidence level of 95% (see the labels on the last row of the table); intersect them and you see t*28 = 2.048.
-
For both groups, you took random sample of 15 cobs, with the Corn-e-stats variety averaging 8.5 inches, and Stats-o-sweet 7.5 inches. So the information you have is:

-
The difference between the sample means

is 8.5 – 7.5 = +1 inch. This means the average for Corn-e-stats minus the average for Stats-o-sweet is positive, making Corn-e-stats the larger of the two varieties, in terms of this sample. Is that difference enough to generalize to the entire population, though? That’s what this confidence interval is going to help you decide.
-
Using the rest of the information you are given, find the confidence interval for the difference in mean cob length for the two brands:

Your 95% confidence interval for the difference between the average lengths for these two varieties of sweet corn is 1 inch, plus or minus 0.9273 inches. (The lower end of the interval is 1 – 0.9273 = 0. 0727 inches; the upper end is 1 + 0. 9273 = 1. 9273 inches.) Notice all the values in this interval are positive. That means Corn-e-stats is estimated to be longer than Stats-o-sweet, based on your data.
The temptation is to say, “Well, I knew Corn-e-stats corn was longer because its sample mean was 8.5 inches and Stat-o-sweet was only 7.5 inches on average. Why do I even need a confidence interval?” All those two numbers tell you is something about those 30 ears of corn sampled. You also need to factor in variation using the margin of error to be able to say something about the entire populations of corn.
