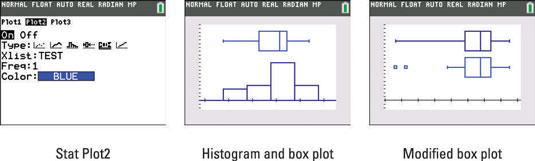
You can use your TI-84 Plus calculator to construct a box plot for your data. Press [2nd][Y=][2] to access Plot2. Follow Steps 1 through 9 for constructing a histogram. In Step 5, select the Box Plot symbol, which looks a bit like a battery turned on its side; see the first screen. If you adjust the viewing window, you can display a histogram and a box plot in the same viewing window (as shown in the second screen).
If your data has outliers (data values that are much larger or smaller than the other data values), consider constructing a modified box plot instead of a box plot. The third screen illustrates both a standard box plot and a modified box plot of the same data.
In a modified box plot, the whiskers represent data in the range defined by 1.5(Q3 – Q1), and the outliers are plotted as points beyond the whiskers. The steps for constructing box plots and modified box plots are the same, except in Step 5 you select the modified box plot symbol.