How to Choose the Right Chart Type in Excel 2010
When you display your data visually in Excel 2010, choosing the right type of chart is just as important as deciding to use a chart at all. Different charts display the data in very different ways. Using the best chart type and format will help you display your data visually in the most meaningful way.

The Insert Chart
dialog box provides access to all the available chart types and subtypes.
Following is a description of the major chart types available in Excel, with some simple guidelines on when to use each type.
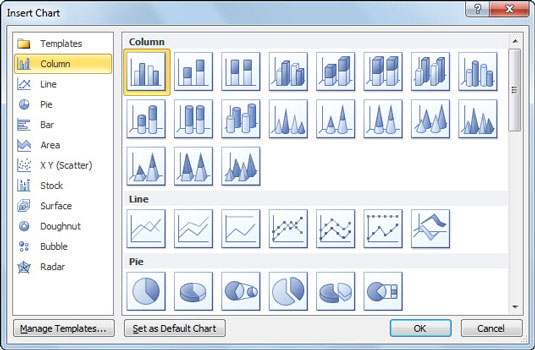
Column charts: A column chart, unlike a bar chart to which it is often compared, emphasizes variation over a period of time. In a column chart, categories appear horizontally and values appear vertically, whereas in a bar chart, categories appear vertically. Variations include the cylinder, cone, and pyramid chart subtypes.
Line charts: A line chart shows the relationship of the changes in the data over a period of time. Although similar to an area chart, which shows the relative importance of values, the line chart emphasizes trends rather than the amount of change.
Pie charts: Pie charts contain just one chart data series. A pie chart shows the relationship of the parts to the whole. To emphasize the importance of one slice of the pie, choose one of the exploded 2-D or 3-D pie charts.
Bar charts: A bar chart (horizontal bars) emphasizes the comparison between items at a fixed period of time. This chart type also includes cylinder, cone, and pyramid subtypes.
Area charts: An area chart shows the relative importance of values over time. An area chart is similar to a line chart, but because the area between lines is filled in, the area chart emphasizes the magnitude of values more than the line chart does.
XY (Scatter) charts: Scatter charts are useful for showing a correlation among the data points that may not be easy to see from data alone. An XY (Scatter) chart uses numeric values along both axes instead of values along the vertical axis and categories along the horizontal axis.
Other Charts: All the other types of charts are lumped together on the drop-down gallery that appears when you click the Other Charts command button on the Ribbon's Insert tab:
Stock charts: Stock charts are used to plot stock quotes over a certain time period, such as a single business day or week. Stock charts show nearly any combination of a stock's highest and lowest values, its open and close values, and the volume of trade for that stock.
Surface charts: Surface charts plot trends in values across two dimensions in a continuous curve. In order to use a surface chart, you need at least two data series, both of which are numeric as with an XY (Scatter) chart.
Doughnut charts: A doughnut chart is similar to a pie chart except for its ability to display more than one data series (pie charts always graph just a single data series).
Bubble charts: Bubble charts compare sets of three values as kind of a combination of an XY (Scatter) chart with an Area chart. When you build a bubble chart, the size of each bubble represented on the x-y grid represents the third set of values being charted.
Radar charts: A radar chart shows changes in data relative both to a center point and to each other. This chart type is useful for making relative comparisons among items.

Excel Glossary
active cell
The worksheet cell that contains the cell cursor. Each worksheet can have only one active cell.

Excel Glossary
AutoComplete
A feature that looks at the entries that you make in a worksheet column and automatically duplicates them in subsequent rows whenever you start a new entry that begins with the same letter or letters as an existing entry in that column.

Excel Glossary
AutoCorrect
A feature that alerts Excel 2007 to common typing errors and your own typing errors (that you specify) and tells the program how it should automatically fix them for you.

Excel Glossary
AutoFill
An Excel 2007 feature that quickly creates a series of entries based on the data you enter in one or two cells. AutoFill works with days of the week, months of the year, yearly quarters; consecutive series of numbers; and formulas. You also can add your own custom AutoFill series.

Excel Glossary
AutoFilter
A feature in Excel 2010 that enables you to temporarily hide everything in a table except the records you specifically want to view, based on criteria you specify.

Excel Glossary
Backstage view
A new feature in Excel 2010 — accessible from the green File tab — that enables you to manage files and to view the properties and stats about the workbook file you're editing.

Excel Glossary
cell
The intersection of a column and row in the worksheet.

Excel Glossary
cell address
The cell identifier, determined by its column letter(s) followed by the row number, as in cell A1, the very first cell of each worksheet at the intersection of column A and row 1.

Excel Glossary
cell cursor
The black border that surrounds the active cell in a worksheet.

Excel Glossary
clip art
Readymade drawings, illustrations, and photos offered by Microsoft for use in Microsoft Office applications.

Excel Glossary
Compatibility Checker
A utility in Excel 2007 and 2010 that you use to find potential compatibility issues if you plan to save an Excel workbook file in the older Excel 97–2003 file format.

Excel Glossary
current cell
The worksheet cell that contains the cell cursor. Each worksheet can have only one current cell.

Excel Glossary
data table
A range of cells in a worksheet in which you enter a series of possible values that Excel plugs into a formula so you can perform what-if analysis on the data.

Excel Glossary
dialog box
A rectangular window with settings and commands that appears when you click a dialog box launcher or certain other commands on the Ribbon.

Excel Glossary
dialog box launcher
A small icon in the lower-right corner of a group of command buttons on the Ribbon that you click to access a dialog box with additional related settings and commands.

Excel Glossary
function
A part of a formula that takes a number of specific arguments and then returns a single value based on those arguments.

Excel Glossary
gallery
A drop-down list of thumbnail selections that appears when you click certain command buttons on the Ribbon.

Excel Glossary
group
A section of a tab on the Excel 2007 Ribbon that organizes related command buttons into subtasks normally performed as part of the tab's larger core task. The name of a group appears at the bottom of the group, such as the Font group on the Home tab.

Excel Glossary
hyperlink
Specially formatted text that anyone can click to jump to Web sites, move to other cells or workbooks, or create an e-mail message.

Excel Glossary
keyboard shortcuts
A combination of keys that you can press to execute certain commands, as opposed to finding and clicking the commands' buttons on the Ribbon or elsewhere.

Excel Glossary
Live Preview
A feature in Excel 2007 that enables you to point to thumbnails on a drop-down gallery to see how a new font, font size, table style, or cell style would look on your selected data before you actually apply it.

Excel Glossary
macro
A series of commands or actions in Excel that are recorded and saved together in a file. You can run the macro whenever you need to perform the task.

Excel Glossary
Name box
The left-most section of the Formula bar that displays the address or name of the current cell.

Excel Glossary
pivot table
A special type of table unique to Excel 2007 that enables you to summarize large amounts of data and pivot or rearrange the table's data to display different summaries of the information it contains.

Excel Glossary
Ribbon
A new feature of the Excel 2007 interface that replaces the menus and toolbars of previous versions; appears at the top of the Excel window, just below the title bar.

Excel Glossary
ScreenTip
A small window that displays descriptive text when you point to but don't click a command on the Ribbon or other objects in a worksheet.

Excel Glossary
sheet tabs
Small tabs near the bottom of a worksheet that you click to move between the worksheets in a workbook. You can assign descriptive names to sheet tabs.

Excel Glossary
slicers
New graphic objects in Excel 2010 that enable you to quickly filter the contents of a PivotTable on more than one field.

Excel Glossary
SmartArt
A type of graphic object in Excel 2007 that gives you the ability to quickly and easily construct graphical lists and diagrams in the worksheet.

Excel Glossary
sparklines
Tiny graphs (miniature charts) that fit within a single cell in the worksheet, used to show basic trends in data.

Excel Glossary
Status bar
A horizontal bar that appears at the bottom of the Excel 2007 window and keeps you informed of Excel's current mode. In addition, you can use the Status bar to select a new worksheet view and to zoom in and out on the worksheet.

Excel Glossary
tabs
The various "pages" of Excel 2007's Ribbon interface that you click to display command buttons relating to the tab's name, such as Page Layout and Formulas.

Excel Glossary
template
A pre-designed worksheet that can be used as a basis for creating new worksheets.

Excel Glossary
WordArt
Stylized text objects that you use to add pizzazz and emphasis to headings and other text in Excel 2007 worksheets.

Excel Glossary
workbook
The basic file type that you create when you use Excel 2007. A new workbook consists of three worksheets by default.

Excel Glossary
worksheet
The main document that you work in when you enter data into cells within Excel 2007. A worksheet is stored in a workbook file.

Excel Glossary
worksheet area
The portion of an Excel 2007 worksheet in which you enter cell data and add objects such as charts and graphics.

Excel Glossary
XPS XML Paper Specification
A file format developed by Microsoft that enables people to open and print documents in XPS Reader without access to the original programs with which the documents were created (such as Excel).

Excel Glossary
Zoom slider
An object on the Status bar in Excel 2007 that enables you to increase the magnification in a worksheet or shrink it down to get an overall picture of the worksheet data.