
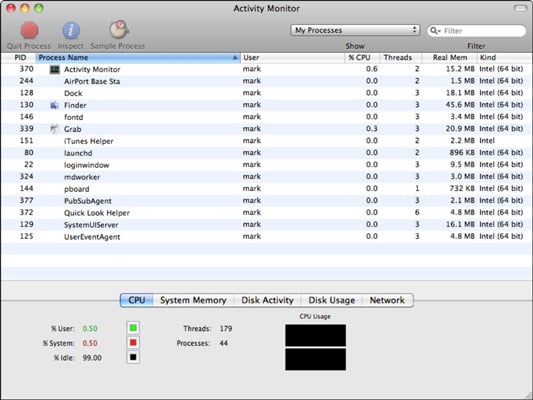
Mac Snow Leopard offers an application called the Activity Monitor, which is designed to show you just how hard your CPU, hard drives, network equipment, and memory modules are working behind the scenes. To run Activity Monitor, open the Utilities folder in your Applications folder.
To display each different type of usage, click the buttons in the lower half of the window; the lower pane changes to reflect the desired type. For example, if you click System Memory, you see the amount of unused memory; click CPU or Network to display real-time usage of your Mac’s CPU and network connections.
You can also display a separate window with your CPU usage; choose Window→CPU Usage or press Command+2. There are three different types of central processing unit (CPU, which is commonly called the “brain” of your Macintosh) displays available from Activity Monitor:
Floating CPU window: This is the smallest display of CPU usage; the higher the CPU usage, the higher the reading on the monitor. You can arrange the floating window in horizontal or vertical mode from the Window menu.
CPU Usage window: This is the standard CPU monitoring window, which uses a blue thermometer-like display. The display works the same as the floating window.
CPU History window: This scrolling display uses different colors to help indicate the percentage of CPU time being used by your applications (green) and what percentage is being used by Snow Leopard to keep things running (red). You can use the History window to view CPU usage over time.
Do you have two (or more) bars in your CPU usage monitor? That’s because you’re running one of Apple’s multiple-core Intel processors. More than one engine is under the hood!
Whichever type of display you choose, you can drag the window anywhere that you like on your Mac OS X Desktop. Use the real-time feedback to determine how well your system CPU is performing when you’re running applications or performing tasks in Mac OS X. If this meter stays peaked for long periods of time while you’re using a range of applications, your processor(s) are running at full capacity.
You can even monitor CPU, network, hard drive, or memory usage right from the Dock! Choose View→Dock Icon; then choose what type of real-time graph you want to display in your Dock. When you’re monitoring CPU usage from the Dock, the green portion of the bar indicates the amount of processor time used by application software, and the red portion of the bar indicates the CPU time given to the Mac OS X operating system.
Note, however, that seeing your CPU capacity at its max doesn’t necessarily mean that you need a faster CPU or a new computer.