The Exponential Smoothing tool in Excel calculates the moving average. However, exponential smoothing weights the values included in the moving average calculations so that more recent values have a bigger effect on the average calculation and old values have a lesser effect. This weighting is accomplished through a smoothing constant.
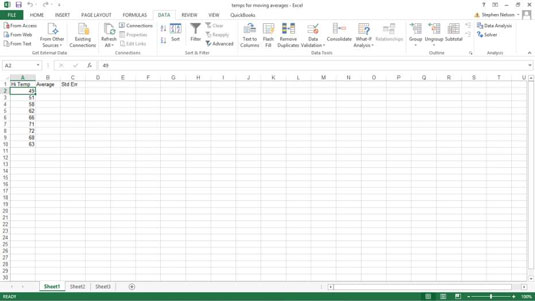
To illustrate how the Exponential Smoothing tool works, suppose that you’re again looking at the average daily temperature information.
To calculate weighted moving averages using exponential smoothing, take the following steps:
To calculate an exponentially smoothed moving average, first click the Data tab’s Data Analysis command button.
When Excel displays the Data Analysis dialog box, select the Exponential Smoothing item from the list and then click OK.
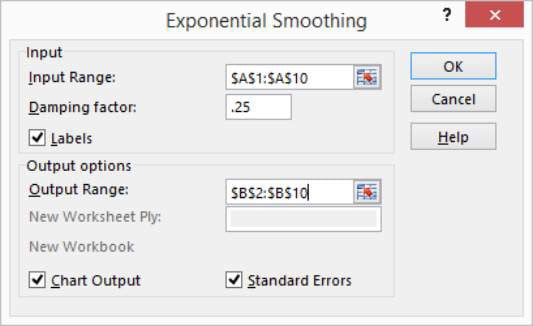
Excel displays the Exponential Smoothing dialog box.
Identify the data.
To identify the data for which you want to calculate an exponentially smoothed moving average, click in the Input Range text box. Then identify the input range, either by typing a worksheet range address or by selecting the worksheet range. If your input range includes a text label to identify or describe your data, select the Labels check box.
Provide the smoothing constant.
Enter the smoothing constant value in the Damping Factor text box. The Excel Help file suggests that you use a smoothing constant of between 0.2 and 0.3. Presumably, however, if you’re using this tool, you have your own ideas about what the correct smoothing constant is. (If you’re clueless about the smoothing constant, perhaps you shouldn't be using this tool.)
Tell Excel where to place the exponentially smoothed moving average data.
Use the Output Range text box to identify the worksheet range into which you want to place the moving average data. In the worksheet example, for example, you place the moving average data into the worksheet range B2:B10.
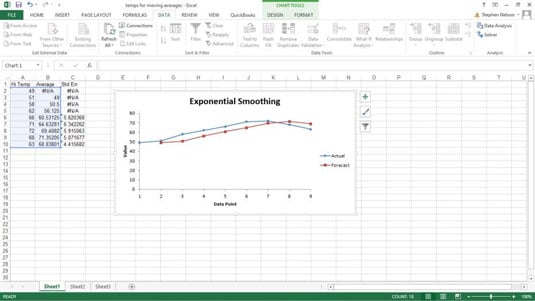
(Optional) Chart the exponentially smoothed data.
To chart the exponentially smoothed data, select the Chart Output check box.
(Optional) Indicate that you want standard error information calculated.
To calculate standard errors, select the Standard Errors check box. Excel places standard error values next to the exponentially smoothed moving average values.
After you finish specifying what moving average information you want calculated and where you want it placed, click OK.
Excel calculates moving average information.