Probability distributions, including the t-distribution, have several moments, including the expected value, variance, and standard deviation (a moment is a summary measure of a probability distribution):
The first moment of a distribution is the expected value, E(X), which represents the mean or average value of the distribution.
For the t-distribution with

degrees of freedom, the mean (or expected value) equals
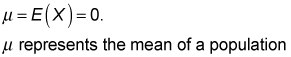
or a probability distribution, and

commonly designates the number of degrees of freedom of a distribution.
The second central moment is the variance

and it measures the spread of the distribution about the expected value. The more spread out a distribution is, the more "stretched out" is the graph of the distribution. In other words, the tails will be further from the mean, and the area near the mean will be smaller. For example, based on the following figures, it can be seen that the t-distribution with 2 degrees of freedom is far more spread out than the t-distribution with 30 degrees of freedom.
You use the formula

to calculate the variance of the t-distribution.
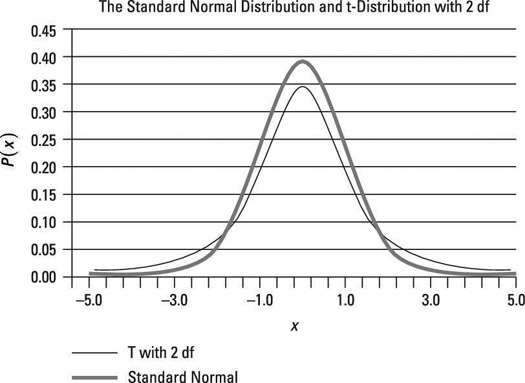 The standard normal and t-distribution with two degrees of freedom.
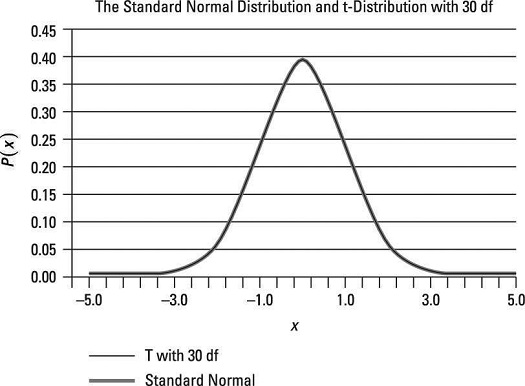 The standard normal and t-distribution with 30 degrees of freedom.
As an example, with 10 degrees of freedom, the variance of the t-distribution is computed by substituting 10 for
in the variance formula:
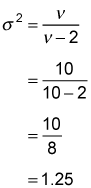
With 30 degrees of freedom, the variance of the t-distribution equals
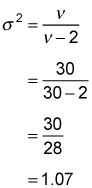
These calculations show that as the degrees of freedom increases, the variance of the t-distribution declines, getting progressively closer to 1.
The standard deviation is the square root of the variance

(It is not a separate moment.)
For the t-distribution, you find the standard deviation with this formula:

For most applications, the standard deviation is a more useful measure than the variance because the standard deviation and expected value are measured in the same units while the variance is measured in squared units. For example, suppose you assume that the returns on a portfolio follow the t-distribution. You measure both the expected value of the returns and the standard deviation as a percentage; you measure the variance as a squared percentage, which is a difficult concept to interpret.