In econometrics, when you collect a random sample of data and calculate a statistic with that data, you’re producing a point estimate, which is a single estimate of a population parameter.
Descriptive statistics are measurements that can be used to summarize your sample data and, subsequently, make predictions about your population of interest. When descriptive measures are calculated using population data, those values are called parameters. When you calculate descriptive measures using sample data, the values are called estimators (or statistics).
You could estimate many population parameters with sample data, but here you calculate the most popular statistics: mean, variance, standard deviation, covariance, and correlation. The following list indicates how each parameter and its corresponding estimator is calculated.
Mean (average): The mean is the simple average of the random variable, X. The population mean for X is

where Xi represents the individual measurements and N is the size of the population. The sample mean is

The difference between the sample and population mean is that that the sample mean uses the sample size n instead of the population size N.
Variance: The variance is the average of the squared differences from the mean. The population variance for a random variable X is
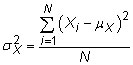
where Xi represents the individual measurements,

is the population mean, and N is the size of the population. The sample variance is
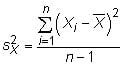
Note that the denominator for the sample variance not only uses the sample size n but also subtracts 1 from that number. This change is known as a degrees of freedom adjustment. Degrees of freedom adjustments are usually important in proving that estimators are unbiased.
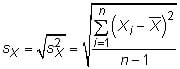
Standard deviation: The standard deviation measures how spread out the random variable is, on average, from the mean. The standard deviation is the square root of the variance, so the population standard deviation for random variable X is
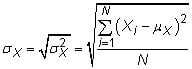
and the sample standard deviation is
Covariance: The covariance measures how much two random variables change together. The population covariance between two random variables X and Y is
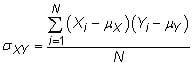
where Xi represents the individual X values, Yi represents the individual Y values, and N is the total number of measurements in the population. The sample covariance is
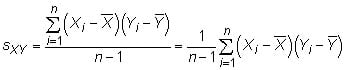
where

is the sample mean of X,

is the sample mean of Y, and n is the sample size.
Correlation: The correlation refers to the relationship between two random variables or sets of data. The population correlation coefficient between two random variables X and Y is

where

is the population covariance,

is the population standard deviation of X, and

is the population standard deviation of Y. The sample correlation coefficient is

where sXY is the sample covariance, sX is the sample standard deviation of X, and sY is the sample standard deviation of Y.
Now, try working with some numbers. The table shows five observations of hamburger sales and prices. Use the formulas to calculate the mean, variance, standard deviation, covariance, and correlation.
| Hamburger Sales (in units), Y | Hamburger Price (in $), X |
|---|---|
| 100 | 1 |
| 80 | 2 |
| 63 | 3 |
| 45 | 4 |
| 21 | 5 |
You can use computer software, such as STATA, to calculate descriptive statistics from the data. By typing “sum” on the command line, you get the descriptive statistics for all the variables in your dataset. If you want the correlation between two variables, select Statistics→Summaries, tables, and tests→Summary and descriptive statistics→Correlations and covariances from the menu bar.
Or you can enter “corr variable1 variable2” on the command line. In your command, replace variable1 and variable2 with the actual names you’ve given the variables in your dataset. You can get covariance by adding an option to the correlation command; type “corr variable1 variable2, cov” on the command line.
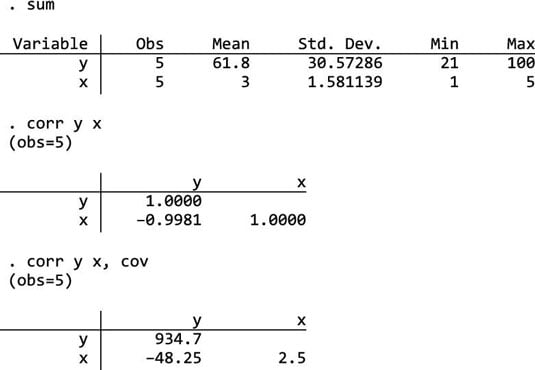
You should verify that your manual calculations of these measures are consistent with STATA’s output.
Summarizing data with descriptive statistics is a relatively simple procedure, but make sure you examine the values carefully. You can use descriptive measures to ensure that your sample contains measurements that are realistic. For example, if your population of interest is college graduates, you wouldn’t expect your random sample from that group to have an average age of 21.
Careful attention to these details provides more credibility in your data and the subsequent inferences you make.