Pre-Calculus: 1001 Practice Problems For Dummies (+ Free Online Practice)

In pre-calculus, you can calculate outputs for rational functions. A rational function is a function that can be expressed as the quotient of two polynomials, such that

where the degree of q(x) is greater than zero.
Here are the steps involved in finding the outputs of (and ultimately graphing) rational functions:
-
Search for vertical asymptotes.
Having the variable on the bottom of a fraction is a problem, because the denominator of a fraction can never be zero. Usually, some domain value(s) of x makes the denominator zero. If there exists an x-value that makes the denominator zero, but not the numerator, then the graph has what’s called a vertical asymptote at this x-value. Graphing the vertical asymptote first shows you the number in the domain where your graph can’t pass through. The graph approaches this point but never reaches it. With that in mind, what value(s) for x can you not plug into the rational function?
The following functions are all rational:
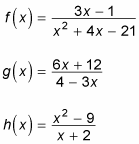
Try to find the value for x in which the function is undefined. Use the following steps to find the vertical asymptote for f(x) first:
-
Set the denominator of the rational function equal to zero.
For f(x), x2 + 4x – 21 = 0.
-
Solve this equation for x.
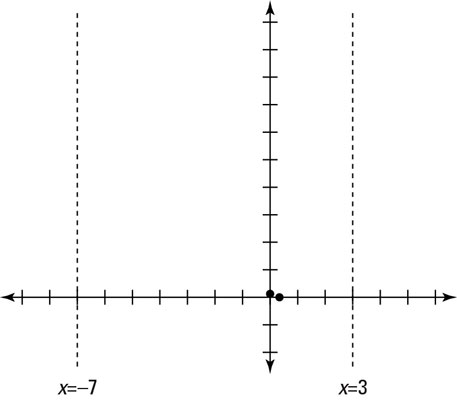
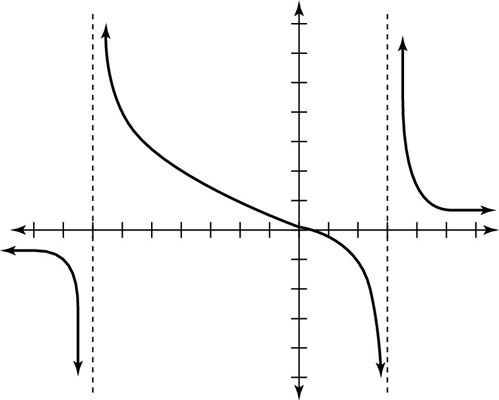
Because this equation is a quadratic, try to factor it. This quadratic factors to (x + 7)(x – 3) = 0. Set each factor equal to zero to solve. If x + 7 = 0, x = –7. If x – 3 = 0, x = 3. Your two vertical asymptotes, therefore, are x = –7 and x = 3, as shown in the figure.
Now you can find the vertical asymptote for g(x). Follow the same set of steps:
4 – 3x = 0
x = 4/3
Now you have your vertical asymptote for g(x). That was easy! Time to do it all again for h(x):
x + 2 = 0
x = –2
Keep these equations for the vertical asymptotes close by because you will need them when you graph later.
-
-
Look for horizontal asymptotes.
To find a horizontal asymptote of a rational function, you need to look at the degree of the polynomials in the numerator and the denominator. The degree is the highest power of the variable in the polynomial expression. Here’s how you proceed:
-
If the denominator has the bigger degree (like in the f(x) example in Step 1), the horizontal asymptote automatically is the x-axis, or y = 0.
-
If the numerator and denominator have an equal degree, you must divide the leading coefficients (the coefficients of the terms with the highest degrees) to find the horizontal asymptote.
If the terms with the highest degrees aren’t written first in the polynomial, you can rewrite both polynomials so that the highest degrees come first. For instance, you can rewrite the denominator of g(x) as –3x + 4 so that it appears in descending order.
The function g(x) has equal degrees on top and bottom. To find the horizontal asymptote, divide the leading coefficients on the highest-degree terms:
You now have your horizontal asymptote for g(x). Hold on to that equation for graphing!
-
If the numerator has the bigger degree of exactly one more than the denominator, the graph will have an oblique asymptote; see Step 3 for more information on how to proceed.
-
-
Seek out oblique asymptotes.
Oblique asymptotes are neither horizontal nor vertical. In fact, an asymptote doesn’t even have to be a straight line at all; it can be a slight curve or a really complicated curve.
To find an oblique asymptote, you have to use long division of polynomials to find the quotient. You take the denominator of the rational function and divide it into the numerator. The quotient (neglecting the remainder) gives you the equation of the line of your oblique asymptote.
You must understand long division of polynomials in order to complete the graph of a rational function with an oblique asymptote.
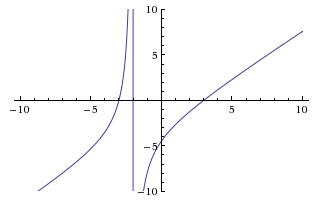
The h(x) example from Step 1 has an oblique asymptote because the numerator has the higher degree in the polynomial. By using long division, you get a quotient of x – 2. This quotient means the oblique asymptote follows the equation y = x – 2. Because this equation is first-degree, you graph it by using the slope-intercept form. Keep this oblique asymptote in mind, because graphing is coming right up!
-
Locate the x- and y-intercepts.
The final piece of the puzzle is to find the intercepts (where the line or curve crosses the x- and y-axes) of the rational function, if any exist:
-
To find the y-intercept of an equation, set x = 0. (Plug in 0 wherever you see x.) The y-intercept of f(x) from Step 1, for instance, is 1/21.
-
To find the x-intercept of an equation, set y = 0 and solve for x.
For any rational function, the shortcut to finding the x-intercept is to set the numerator equal to zero and then solve. Sometimes when you do this, however, the equation you get is unsolvable, which means that the rational function doesn’t have an x-intercept.
The x-intercept of f(x) is 1/3.
This figure shows the graph for f(x).
Now find the intercepts for g(x) and h(x) from Step 1. Doing so, you find the following points:
-
g(x) has a y-intercept at 3 and an x-intercept at –2.
-
h(x) has a y-intercept at –9/2 and x-intercepts at

-
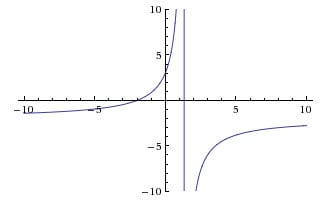
Here is the graph for g(x):
Here is the graph for h(x):