Maybe you want to work with only one part of your data. You can be more selective when working with data on the TI-Nspire. For example, you can isolate one parabola from a data experiment involving a bouncing-ball.
To get a better view of the Position graph, press [MENU]→Graph→Show Graph→Graph 1. Follow these steps to select part of your data:
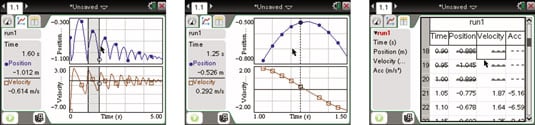
Select the region you would like to work with. On the handheld, click the graph and hold for one second; then use the Touchpad keys to highlight a region on the graph. On the Computer Software, click and drag to select the region.
See the first screen.
Right-click, [CTRL][MENU]→Strike Data→Outside Selected Region.
Alternatively, you could have highlighted the region of the graph that you wanted to remove (the data is not deleted permanently) and chosen to strike the data Inside Selected Region. The graph only displays the data from one bounce.
Notice that some of the data in the Table view has a line through it to indicate that it has been removed. The struck-through data has not been permanently deleted, just temporarily ignored. Unlike TI-84/EasyData where the data does get deleted, this tool allows you to restore data that has been struck. See the second and third screens.
You can restore the data that was removed. Press [MENU]→Data→Restore Data→All Data. The graph window automatically adjusts to accommodate the change. Don’t you just love working in a dynamic environment?