
You can approximate the area under a curve by adding up “right” rectangles. This method works just like the left sum method except that each rectangle is drawn so that its right upper corner touches the curve instead of its left upper corner.
For example, here’s how you would estimate the area under
from 0 to 3 by using three right rectangles. See the figure below.
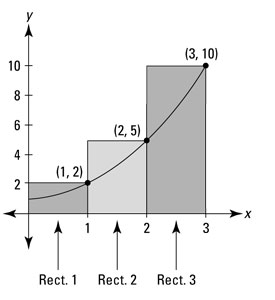
The heights of the three rectangles are given by the function values at their right edges: f(1) = 2, f(2) = 5, and f(3) = 10. Each rectangle has a width of 1, so the areas are 2, 5, and 10, which total 17. This approximation gives you an overestimate of the actual area under the curve.
The more rectangles you create between 0 and 3, the more accurate your estimate will be. Here's the formula.
Right Rectangle Rule: You can approximate the exact area under a curve between a and b,

with a sum of right rectangles given by this formula:
Where, n is the number of rectangles,
is the width of each rectangle, and the function values are the heights of the rectangles.
Now if you compare this formula to the one for a left rectangle sum,
you get the complete picture about those subscripts. The two formulas are the same except for one thing. Look at the sums of the function values in both formulas. The right sum formula has one value,
that the left sum formula doesn’t have, and the left sum formula has one value,
that the right sum formula doesn’t have. All the function values between those two appear in both formulas. You can get a better handle on this by comparing the three right rectangles in the above figure to the three left rectangles in the figure below.
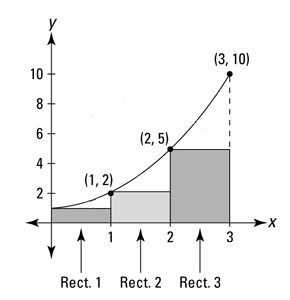
As you saw above, the three right rectangles add up to: 2 + 5 + 10 = 17
And the three left rectangles add up to: 1 + 2 + 5 = 8
The sums of the areas are the same except for the right-most right rectangle and the left-most left rectangle. Both sums include the rectangles with areas 2 and 5. If you look at how the rectangles are constructed, you can see that the second and third rectangles in the second figure are the same as the first and second rectangles in the first figure.
One last thing. The difference between the right rectangle total area (17) and the left rectangle total area (8) — that’s 17 minus 8, or 9, in case you love calculus but don’t have the basic subtraction thing down yet — comes from the difference between the areas of the two “end” rectangles just discussed (10 minus 1 is also 9). All the other rectangles are a wash, no matter how many rectangles you have. For this particular example, because the curve is increasing, a left-rectangle sum will always be an underestimate and a right-rectangle sum will always be an overestimate regardless of how many rectangles are used for the estimate. And finally, as more and more rectangles are used and as the rectangles become skinnier and skinnier, the difference between the left-rectangle and right-rectangle estimates gets smaller and smaller — and both estimates approach the true, exact area under the curve.