
The Vernier DataQuest application for TI-Nspire has many built-in tools that allow you to analyze the data. The Infobox on the left side of the screen shows the Analyze tools that you have chosen to activate.
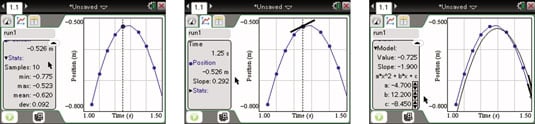
Use the Statistics feature to display information about the data. Press [MENU]→Analyze→Statistics to display your results in the Infobox on the left side of the screen, including number of samples, minimum, maximum, mean, and standard deviation. See the first screen.
The Tangent tool can be used to draw a tangent line to the curve. The slope of the tangent line is recorded in the Infobox on the left. To open this tool, press [MENU]→Analyze→Tangent. See the second screen.
Use the Integral tool to display the area under a curve. Press [MENU]→Analyze→Integral to open the tool. The Graph view shades the region under the curve, and the Infobox on the left displays the calculated area under the curve.
The Analyze tools that display in the Infobox on the left side of the screen can be minimized or maximized (like a folder in My Documents). To minimize an Analyze tool, press
next to the tool, or to maximize a tool, press
next to the tool.
Use the Model tool to manually determine the curve of best fit for the data. Press [MENU]→Analyze→Model to open the tool. Click the drop-down menu in the dialog box to choose the model that you want. See the third screen. After you choose the initial values for the parameters, you can adjust the parameters by clicking the
arrows in the Infobox.
You can also automatically find the curve of best fit by performing a regression. Press [MENU]→Analyze→Curve Fit. Choose Quadratic Regression. The graph displays in Graph view, and the function parameters are displayed in the Infobox.
The Analyze tools can be deleted by pressing [MENU]→Analyze→Remove and choosing the tool that you would like to remove.