
You can add a chart to an existing PowerPoint 2013 slide by using the Insert tab to insert a chart into any slide. Add a chart to your slide by following these steps:
Move to the slide on which you want to place the chart. Activate the Insert tab on the Ribbon.

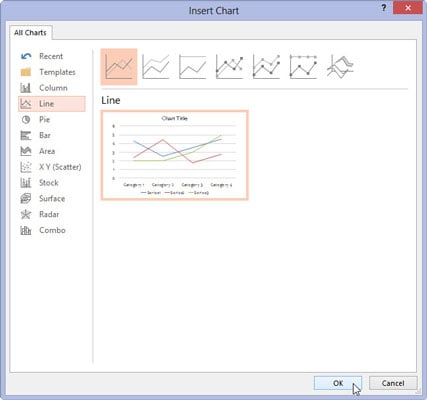
Click the Chart button in the Illustrations group to summon the Insert Chart dialog box.
Select the type of chart you want to create and then click OK.
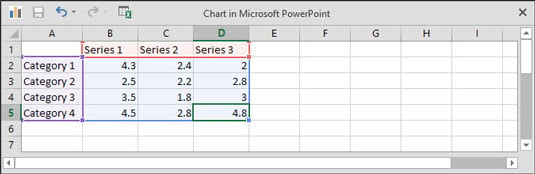
PowerPoint launches Excel (if it isn’t already running) and inserts a chart based on sample data.
Change the sample data to something more realistic.
Finish the chart by setting the chart layout and style.
Rearrange everything.

The chart undoubtedly falls on top of something else already on the slide. You probably need to resize the chart by selecting it and then dragging it by the love handles. You can move the chart like any other object: Just click and drag it to a new location.
You might also need to move, resize, or delete other objects to make room for the chart or change the layer order of the chart or other surrounding objects.