Not every function is defined at every value of x. Rational functions, for example, are undefined if the denominator of the function is 0. You can use a limit (which, if it exists, represents a value that the function tends to approach as the independent variable approaches a given number) to look at a function to see what it would do if it could.
To do so, you take a look at the behavior of the function as the variable x approaches the undefined value(s). For example, this function is undefined at x = 3:
You can look at the values of f(x) at x = 2, x = 2.9, x = 2.99, x = 2.999, and so on. Then you can look at the values of f(x) again from the other side: x = 4, x = 3.1, x = 3.01, and so on. All these values of f(x) are defined, except for x = 3.
To express a limit in symbols, you write
which is read as "the limit as x approaches c of f(x) is L." L is the limit you're looking for. For the limit of a function to exist, the left limit and the right limit must both exist and be equal:
A left limit of (x) is the value that f(x) is approaching when x approaches n from values less than c (from the left-hand side of the graph).
A right limit of f(x) is the exact opposite; it is the value that f(x) is approaching when x approaches c from values greater than c (from the right-hand side of the graph).
If, and only if, the left-hand limit equals the right-hand limit can you say that the function has a limit for that particular value of c.
Mathematically, you'd let f be a function and let c and L be real numbers. Then
exactly when
In real-world language, this setup means that if you took two pencils, one in each hand, and started tracing along the graph of the function in equal measures, the two pencils would have to meet in one spot in the middle in order for the limit to exist. (The figure shows that even though the function isn't defined at x = 3, the limit exists as x approaches 3.)
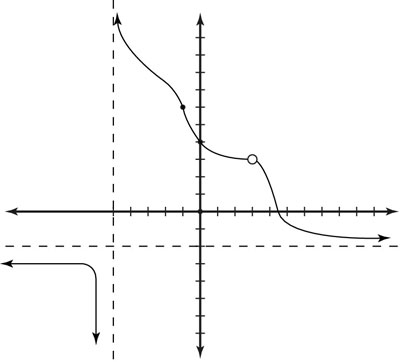
For functions that are well connected, the pencils always meet eventually in a particular spot (in other words, a limit would always exist). However, sometimes they do not (as you see in the figure as x approaches –5). The popular unit-step function is defined as f(x) = 0 for
and f(x) = 1 for x > 0. If you draw this function, you see a unit step jump at x = 0.