


An asymptote is a line that helps give direction to a graph of a trigonometry function. This line isn’t part of the function’s graph; rather, it helps determine the shape of the curve by showing where the curve tends toward being a straight line — somewhere out there. Asymptotes are usually indicated with dashed lines to distinguish them from the actual function.
The asymptotes for the graph of the tangent function are vertical lines that occur regularly, each of them π, or 180 degrees, apart. They separate each piece of the tangent curve, or each complete cycle from the next.
The equations of the tangent’s asymptotes are all of the form
![]()
where n is an integer. Under that stipulation for n, the expression 2n + 1 always results in an odd number. By replacing n with various integers, you get lines such as
![]()
The reason that asymptotes always occur at these odd multiples of
![]()
is because those points are where the cosine function is equal to 0. As such, the domain of the tangent function includes all real numbers except the numbers that occur at these asymptotes.
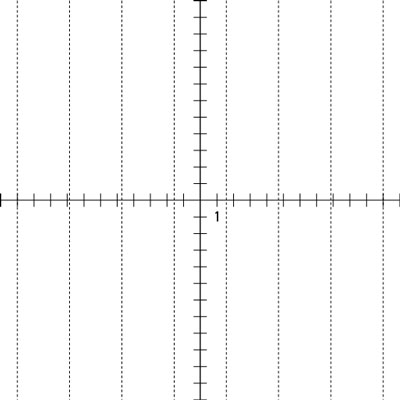
The preceding figure shows what the asymptotes look like when graphed alone.
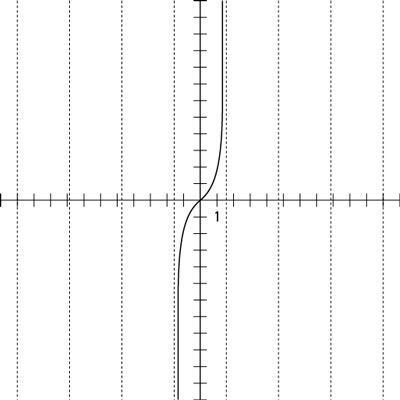
The first figure isn’t all that exciting, but it does show how many times the tangent function repeats its pattern. Now take a look at the second preceding figure, which shows one cycle of the tangent function on a graph. The tangent values go infinitely high as the angle measure approaches 90 degrees. The values go infinitely low as the angle measure approaches –90 degrees.
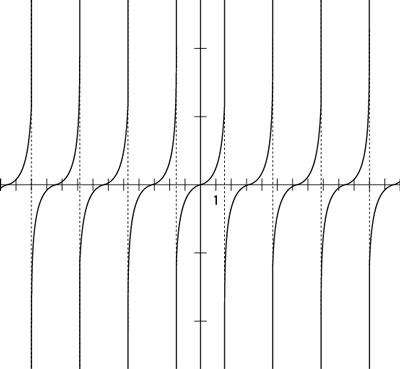
In the third figure, there is more of the tangent on a graph, asymptotes included, to give you a better idea of what’s going on.
As you can see, the tangent function repeats its values over and over. The main difference between this function and the sine and cosine functions is that the tangent has all these breaks between the cycles. As you move from left to right, the tangent appears to go up to positive infinity. It actually disappears at the top of the graph and then picks up again at the bottom, where the values come from negative infinity. Graphing calculators and other graphing utilities don’t usually show the graph disappearing at the top, so it’s up to you to know what’s actually happening, even though the picture may not look exactly that way.
One of the peculiarities of graphing calculators is that they try to connect the tangent function to make it continuous across the screen. For this reason, you’ll usually see some lines between the different parts of the curve. In a way, these lines are errors — they aren’t the asymptotes, although you may be tempted to think they are. The only way to get rid of those extra lines is to turn your calculator to the dot mode (as opposed to the connected mode). Most calculators have ways to set the settings (or mode) for things such as degrees and radians, dotted graphs and connected graphs, floating decimals and fixed decimals, and so on. The changes are usually easy to do — just see your calculator’s manual for specific instructions. The hard part is remembering what setting you’re in.

