
The probability of correctly rejecting H0 when it is false is known as the power of the test. The larger it is, the better.
Suppose you want to calculate the power of a hypothesis test on a population mean when the standard deviation is known. Before calculating the power of a test, you need the following:-
The previously claimed value of

in the null hypothesis,

-
The one-sided inequality of the alternative hypothesis (either < or >), for example,

-
The mean of the observed values
-
The population standard deviation
-
The sample size (denoted n)
-
The level of significance
-
Assume that H0 is true, and

-
Find the percentile value corresponding to

sitting in the tail(s) corresponding to Ha. That is, if

then find b where

If

then find b where
-
Assume that H0 is false, and instead Ha is true. Since

under this assumption, then let

in the next step.
-
Find the power by calculating the probability of getting a value more extreme than b from Step 2 in the direction of Ha. This process is similar to finding the p-value in a test of a single population mean, but instead of using

you use

versus
You conduct a random sample of 100 working mothers and find they spend an average of 11.5 minutes per day talking with their children. Assume prior research suggests the population standard deviation is 2.3 minutes.
When conducting this hypothesis test for a population mean, you find that the p-value = 0.015, and with a level of significance of
you reject the null hypothesis. But there are a lot of different values of
(not just 11.5) that would lead you to reject H0. So how strong is this specific test? Find the power.
-
Assume that H0 is true, and

-
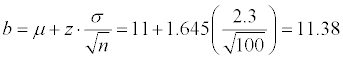
Find the percentile value corresponding to

sitting in the upper tail. If p(Z > zb) = 0.05, then zb = 1.645. Further,
-
Assume that H0 is false, and instead

-
Find the power by calculating the probability of getting a value more extreme than b from Step 2 in the direction of Ha. Here, you need to find p(Z > z) where
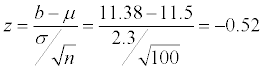
Using the Z-table, you find that

of 0.05. Further, you found that Power = 0.6985, meaning that there was nearly a 70 percent chance of correctly rejecting a false null hypothesis.
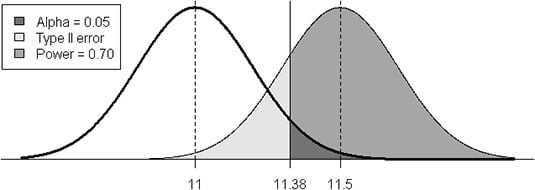
This is just one power calculation based on a single sample generating a mean of 11.5. Statisticians often calculate a “power curve” based on many likely alternative values. Also, there are some unique considerations to take into account if
but this gives you the gist of things.