
The standard deviation is a measurement statisticians use for the amount of variability (or spread) among the numbers in a data set. As the term implies, a standard deviation is a standard (or typical) amount of deviation (or distance) from the average (or mean, as statisticians like to call it). So the standard deviation, in very rough terms, is the average distance from the mean.
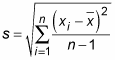
The formula for sample standard deviation (denoted by s) is as follows, where n equals the number of values in the data set, each xi represents a value in the data set, and
is the average of all the data:
The standard deviation is also used to describe where most of the data should fall, in a relative sense, compared to the average. For example, if your data have the form of a bell-shaped curve (also known as a normal distribution), about 95% of the data lie within two standard deviations of the mean. (This result is called the empirical rule, or the 68–95–99.7% rule.)
The standard deviation is an important statistic, but it is often absent when statistical results are reported. Without it, you’re getting only part of the story about the data. Statisticians like to tell the story about the man who had one foot in a bucket of ice water and the other foot in a bucket of boiling water. He said on average he felt just great! But think about the variability in the two temperatures for each of his feet. Closer to home, the average house price, for example, tells you nothing about the range of house prices you may encounter when house-hunting. The average salary may not fully represent what’s really going on in your company, if the salaries are extremely spread out.
Don’t be satisfied with finding out only the average — be sure to ask for the standard deviation as well. Without a standard deviation, you have no way of knowing how spread out the values may be. (If you’re talking starting salaries, for example, this could be very important!)