
Compared with other types of hypothesis tests, constructing the test statistic for ANOVA is quite complex. The first step in finding the test statistic is to calculate the error sum of squares (SSE).
Calculating the SSE enables you to calculate the treatment sum of squares (SSTR) and total sum of squares (SST). When you compute SSE, SSTR, and SST, you then find the error mean square (MSE) and treatment mean square (MSTR), from which you can then compute the test statistic.
The test statistic is a numerical value that is used to determine if the null hypothesis should be rejected. The form of the test statistic depends on the type of hypothesis being tested. If the test statistic has an extremely large positive or negative value, this may be a sign that the null hypothesis is incorrect and should be rejected.
For example, say a manufacturer randomly chooses a sample of four Electrica batteries, four Readyforever batteries, and four Voltagenow batteries and then tests their lifetimes. This table lists the results (in hundreds of hours).
| Sample | Electrica | Readyforever | Voltagenow |
|---|---|---|---|
| Battery 1 | 2.4 | 1.9 | 2.0 |
| Battery 2 | 1.7 | 2.1 | 2.3 |
| Battery 3 | 3.2 | 1.8 | 2.1 |
| Battery 4 | 1.9 | 1.6 | 2.2 |
Each element in this table can be represented as a variable with two indexes, one for the row and one for the column. In general, this is written as Xij. The subscript i represents the row index, and j represents the column index. For example, X23 represents the element found in the second row and third column. (In the table, this is 2.3.) X31 represents the element found in the third row and the first column. (In the table, this is 3.2.)
The following table shows the appropriate indexes for all the elements in first table.
| Sample | Electrica | Readyforever | Voltagenow |
|---|---|---|---|
| Battery 1 | X11 | X12 | X13 |
| Battery 2 | X21 | X22 | X23 |
| Battery 3 | X31 | X32 | X33 |
| Battery 4 | X41 | X42 | X43 |
The data in the first table is used to construct the test statistic. The first step in constructing the test statistic is to calculate the error sum of squares.
The error sum of squares is obtained by first computing the mean lifetime of each battery type. For each battery of a specified type, the mean is subtracted from each individual battery's lifetime and then squared. The sum of these squared terms for all battery types equals the SSE.
SSE is a measure of sampling error. This refers to the fact that the values computed from a sample will be somewhat different from one sample to the next.
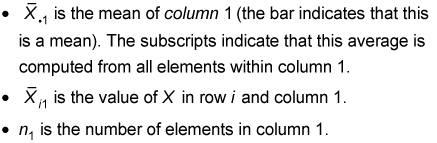
To compute the SSE for this example, the first step is to find the mean for each column. So, for example, you find the mean of column 1, with this formula:

Here's what each term means:
So, using the values in the first table, you find the mean of column 1 like so:
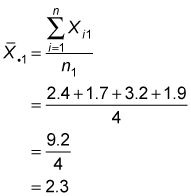
In other words, you sum the lifetimes of the four Electrica batteries and divide by 4. The mean lifetime of the Electrica batteries in this sample is 2.3.
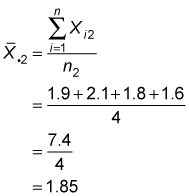
Similarly, you find the mean of column 2 (the Readyforever batteries) as
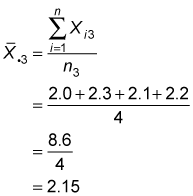
And column 3 (the Voltagenow batteries) as
The next step is to subtract the mean of each column from each element within that column, then square the result. The calculations appear in the following table.
| Sample | Electrica | Readyforever | Voltagenow |
|---|---|---|---|
| Battery 1 | (2.4 – 2.3)2 = 0.01 | (1.9 – 1.85)2 = 0.0025 | (2.0 – 2.15)2 = 0.0225 |
| Battery 2 | (1.7 – 2.3)2 = 0.36 | (2.1 – 1.85)2 = 0.0625 | (2.3 – 2.15)2 = 0.0225 |
| Battery 3 | (3.2 – 2.3)2 = 0.81 | (1.8 – 1.85)2 = 0.0025 | (2.1 – 2.15)2 = 0.0025 |
| Battery 4 | (1.9 – 2.3)2 = 0.16 | (1.6 – 1.85)2 = 0.0625 | (2.2 – 2.15)2 = 0.0025 |
| Sum | 1.34 | 0.13 | 0.05 |
For example, because 2.3 is the mean of column 1, you subtract 2.3 from each element in column 1. You square the result in each row, and the sum of these squared values is 1.34. Repeat the process for columns 2 and 3 to get sums of 0.13 and 0.05, respectively. Add up the sums to get the error sum of squares (SSE): 1.34 + 0.13 + 0.05 = 1.52.
The error sum of squares shows how much variation there is among the lifetimes of the batteries of a given type. The smaller the SSE, the more uniform the lifetimes of the different battery types.