The Maclaurin series is a template that allows you to express many other functions as power series. It is the source of formulas for expressing both sin x and cos x as infinite series.
Without further ado, here it is:
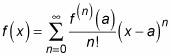
The notation f(n) means “the nth derivative of f.” This becomes clearer in the expanded version of the Maclaurin series:
The Maclaurin series allows you to express functions as power series by following these steps:
Find the first few derivatives of the function until you recognize a pattern.
Substitute 0 for x into each of these derivatives.
Plug these values, term by term, into the formula for the Maclaurin series.
If possible, express the series in sigma notation.
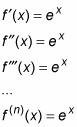
For example, suppose that you want to find the Maclaurin series for ex.
Find the first few derivatives of ex until you recognize a pattern:
Substitute 0 for x into each of these derivatives.
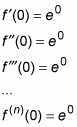
Plug these values, term by term, into the formula for the Maclaurin series:
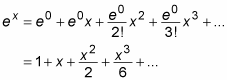
If possible, express the series in sigma notation:

To check this formula, use it to estimate e0 and e1 by substituting 0 and 1, respectively, into the first six terms:
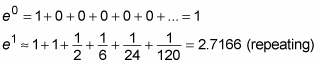
This exercise nails e0 exactly, and approximates e1 to two decimal places. The Maclaurin series for ex allows you to calculate this function for any value of x to any number of decimal places.
However, the Maclaurin series for ex works best when x is close to 0. As x moves away from 0, you need to calculate more terms to get the same level of precision.
But now, you can begin to see why the Maclaurin series tends to provide better approximations for values close to 0: The number 0 is “hardwired” into the formula as f(0), f'(0), f"(0), and so forth.
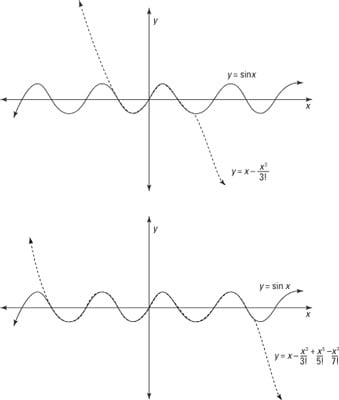
The figure illustrates this point. The first graph shows sin x approximated by using the first two terms of the Maclaurin series — that is, as the third-degree polynomial
The second graph shows an approximation of sin x with four terms.
As you can see, each successive approximation improves upon the previous one. Furthermore, each equation tends to provide its best approximation when x is close to 0.