Dashboards are reporting mechanisms that deliver business intelligence in a graphical form. Most data analysis benefits from a spreadsheet, so Excel is inherently part of any business-intelligence tool portfolio.
This Cheat Sheet provides some useful information and tips for working with Excel dashboards and reports.
Adding symbol fonts to your Excel dashboards and reports
A creative alternative to using the icon sets offered with conditional formatting is to use the various symbol fonts that come with Microsoft Office. These fonts — Wingdings, Wingdings2, Wingdings3, and Webdings — display symbols for each character instead of the standard numbers and letters.
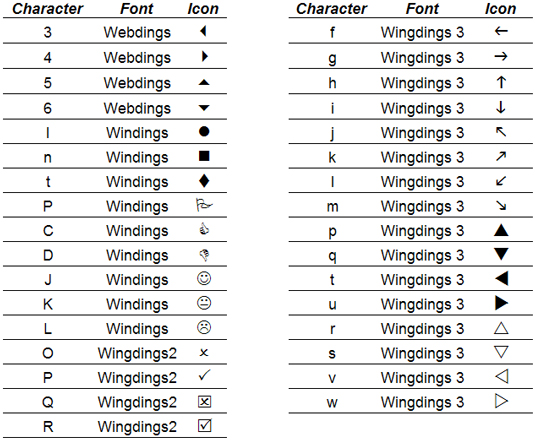
The idea here is simple: Make a formula that returns a character, and then change the font so that the symbol for that character is shown based on the font you select.
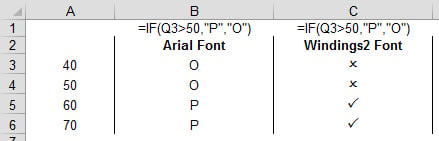
For example, imagine you want to test whether values in column A are greater than 50. You can enter the formula =IF(A1>50,”P”,”O”), as shown in the figure below. In a standard font like Arial, this formula would return either a P or an O. However, if you change the font to Wingdings2, you see a check mark or an X.
Great online resources for Excel dashboards and reports
It’s always nice to see the approach others have taken to design their reporting mechanisms. Below, is a list of sites (in no particular order) dedicated to business intelligence and the presentation of data through dashboards. I often visit these sites to get ideas and fresh new perspectives on dashboards and reports.
- Perceptual Edge: Visualization expert Stephen Few provides some fascinating insights on data visualization and dashboarding. A generous amount of articles and examples can be found at his website and blog.
- Edward Tufte: Professor Edward Tufte is an icon in the field of information design and data visualization. He shares his thoughts around visual communication in a series of articles at his website. Although many of this ideas are academic in nature, they’ll get you thinking in new ways about how to best present data.
- Chandoo: Chandoo (also known as Purna Chandra) came out of nowhere around 2007 to amaze us all with his innovative Excel tips via his blog. He has a knack for clean, simple visualization techniques, which he shares freely with all his readers.
- Peltier Technical Services: Although this site isn’t dedicated to dashboarding, Jon Peltier offers more than 200 pages of unique and effective Excel charting ideas. A quick look at the excellent tutorials posted on his site will have you reeling with new ideas on how to chart your Excel data.
- ExcelCharts.com: Jorge Camoes’s blog and website is focused on helping his readers make sense of their business data through better data analysis and visualization techniques. With several years’ worth of articles, this site is a rich source of dashboarding concepts.
- Storytelling with Data: Cole Nussbaumer Knaflic uses her site to focus on examples of visualizations that tell a story about data. She and her team do a brilliant job pointing out examples of good and bad visualization design.
- Juice Analytics: Zach and Chris Gemignani of Juice Analytics use their site as a platform to critique charts and offer interesting ideas around reporting data.