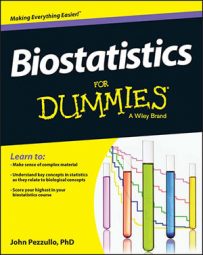
For a correlation test in biostatistics (such as the Pearson or Spearman test), pick the scatter chart that looks like an important amount of correlation. Each chart shows the value of r (the correlation coefficient) and the required number of analyzable subjects (each providing an x and a y value). For example, if the scatter chart in the lower left corner (corresponding to r = 0.6) appears to show an important amount of correlation, you’ll need about 20 analyzable subjects.
![[Credit: Illustration by Wiley, Composition Services Graphics]](https://www.dummies.com/wp-content/uploads/382138.image0.jpg)
Credit: Illustration by Wiley, Composition Services Graphics
For other r values that aren’t in the preceding scatter charts, use this rule of thumb to estimate sample size: You need about 8/r2 – 3 analyzable subjects.