
You can measure the manner in which data is distributed around the average in a few different ways. Obviously, not all the numbers in a data set are going to be exactly the same as the average. Say that the average net income of a corporation is $10,000. That’s great, but it doesn’t tell you whether that number changes much.
The corporation may very consistently earn $10,000 every year, or it may earn $0 in the year before and $20,000 the year after. This information is the sort of thing worth knowing, and you can measure it in a few ways.
Range is very simple; it’s simply the difference between the largest and smallest values. So, if a corporation had earnings of $10,000 and $20,000, then you can say it had a two-year range of $10,000, or 100 percent.
If you were to look at the range for the corporation’s earnings over the last 20 years, you may want to pay attention to its interquartile range (the range of the middle 50 percent of values) to make sure that the corporation didn’t experience unusually high or low earnings in certain years, which would throw off your data.
To find the interquartile range, you’d take the earnings from all the years and put them in numerical order, divide them into four equal pieces, and then just take the range of the middle two pieces. So, if a corporation’s earnings had a range of $100,000 but an interquartile range of only $20,000, you may think that the corporation had some extreme dispersion in its earnings in some of those years.
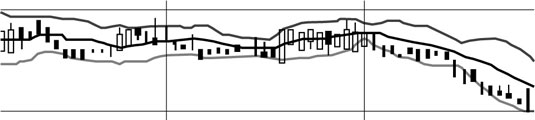
On graphs, these ranges are often illustrated in a couple ways. To compare changes in specified time intervals, box plots are often used to show changes in the mean and distribution of financial data, while changing trends in dispersion are often included in Bollinger bands. (The figure illustrates the mean, maximum, and minimum values in a range over time.)
Standard deviation, another measure of distribution, this time represented by the letter σ (sigma), is a concept used quite frequently in equations, and here’s how you calculate it:
Calculate the mean.
For example:
1, 2, 3, 4, 5; Mean = 3
Subtract each value from the mean
For example:
3–1=2, 3–2=1, 3–3=0, and so on
Square each difference.
For example:
22=4, 12=1, 02=0, -12=1, -22=4
Add the squares together.
For example:
4+1+0+1+4 = 10
Divide the answer by the number of values.
For example:
10/5 = 2
Take the square root of the answer from Step 5
For example:
√2 = 1.41
So, the standard deviation is 1.41. That means that the dispersion of the values away from the mean is measured in units worth 1.41 each.