
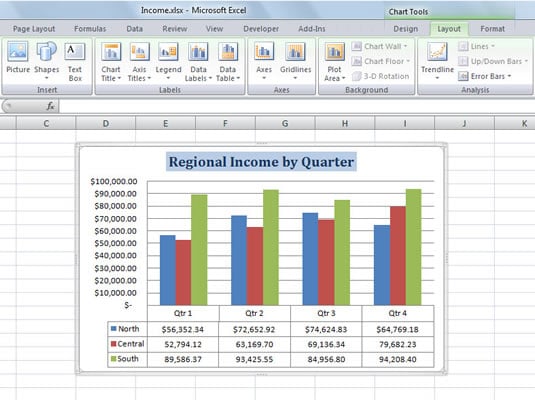
The command buttons on the Chart Tools Layout tab in Excel 2007 make it easy to change or customize particular parts of your chart. This customization includes buttons in the following groups on the Layout tab:
Insert group
Click the Picture button to insert a picture from a file into the chart, such as a company logo.
Click the Shapes button to insert an object from a gallery of shapes, or click the Text Box button to add an object which you can use to further annotate the chart.
Labels group
Click the Chart Title or Axis Titles button to add titles to these areas of the chart. A drop-down menu appears, and you can choose the position of the title.
Click the Legend button to remove or reposition a legend in the chart. You can place the legend on any side of the chart.
Click the Data Labels button to add the values of the chart’s data points to the chart in one of the positions indicated on the drop-down menu. Click the Data Table button to display a data table with all the charted values below the chart.
Axes group
Click the Axes button if you want to change the formatting or position of the x-axis or y-axis.
Click the Gridlines button display or remove horizontal and/or vertical gridlines.
Background group
Use the buttons in this group to modify the appearance of the chart’s background, including the plot area for 2-D charts and the chart wall, floor, and view for 3-D charts.
Analysis group
The buttons in this group enable you to further analyze your chart by adding a trendline or error bars for all chart types, and drop lines or up/down bars for line charts.
If none of the preset options for the Layout tab’s command buttons fit your needs, click the More option at the bottom of the drop-down list to open a dialog box for the selected chart element, normally containing Fill, Line, Line Style, Shadow, 3-D Format, and Alignment tabs, with oodles of options that you can use to customize the chart element.
The Properties group at the end of the Layout tab contains a sole Chart Name text box that you can use to modify the generic chart name (Chart 1, Chart 2, and so forth). If your worksheet contains more than one chart, you may find it advantageous to give it a more descriptive name.