


TI-Nspire gives you the option of changing your graph’s line weight (thin, medium, thick), line style (continuous, dotted, dashed), label style, and whether the graph is continuous or discrete. Press [MENU]→Actions→Attributes, move your cursor over an object until an
appears, then click on the object. Alternatively, perform a right-click by moving your cursor to the graph and pressing [CTRL][MENU]→Attributes.
After opening the Attributes menu, press the
keys to move through the different options (line weight, line style, and so on). Use the
keys to view the different options within each attribute and preview.
To put an attribute into effect, you must use the Touchpad keys to select it and then press [ENTER]. To exit the Attributes menu without making a change, press [ESC].
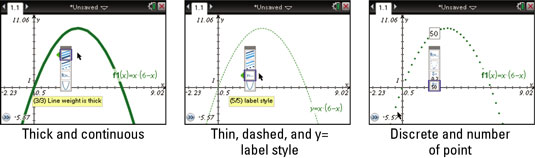
Here are some examples of different attributes that you can assign to a graph.
If you are using TI-Nspire CX or TI-Nspire Computer Software, then you can do more than just change the shades of grey, you can change the color of the graphed function. Each new function that you add in the Graphs application comes in a new color. By default, the first function is red, the second is green, then blue, magenta, orange, navy, and brown.
To change the color of a graphed function, hover over the function and press [CTRL][MENU]→Color. Click on the color of your choosing.

