As with a dot plot, you can change variables or use the Add/Remove Variable options located on the [MENU]→Plot Properties submenu on the TI-Nspire. Remember to use the Add/Remove tools to change your histogram from a vertical orientation to a horizontal orientation and vice versa.
The command =sum(randint(0,1,10) can be used to simulate guessing on 10 straight true/false questions. This formula generates a list of 10 integers that are either 0 or 1 and calculates the sum. If you assign a 1 to represent a correct answer, a result of 6 means that you got 6 out of 10 questions correct.
First, use the Fill command to copy this formula to cell A100. Then use Quick Graph to graph a histogram of the data as shown in the first screen.
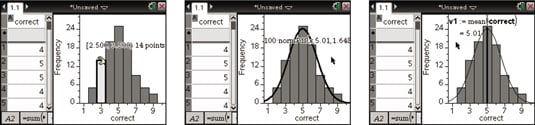
This binomial experiment should have a shape that resembles a normal distribution. Press [MENU]→Analyze→Show Normal PDF to overlay a normal curve on your histogram. The normal graph is based on the mean of the data set (in this case, the mean is 5.01) and the standard deviation (1.648). See the second screen.