Your business is practicing third-degree price discrimination when you partition the market into two or more different groups of consumers based upon different price elasticities of demand. The differences in elasticity enable you to charge customers in each group purchasing the good different prices.
Groups possess different price elasticities of demand for any number of reasons. Differences in income, tastes, or availability of substitutes can account for variation in elasticities. Examples of third-degree price discrimination include different prices for senior citizens, variation in airline ticket prices depending upon when the ticket is purchased, and student discounts.
After you determine that you can separate potential consumers into two or more groups with different price elasticities of demand, you must determine the quantity of output to sell to each group and the good’s price for each group.
Assuming your goal is profit maximization (and why wouldn’t it be?), you allocate output in order to satisfy two criteria. First, you sell the quantity of output that results in the marginal revenue of the last unit sold to each group equal for all groups. Second, the marginal revenue of the last unit sold to any group must equal the marginal cost of the last unit your firm produces.
If marginal revenue isn’t equal for all groups, you can increase profit by reallocating units of the good to the group that has the higher marginal revenue. If marginal revenue is greater than marginal cost, you’re able to increase profit by producing more units of output.
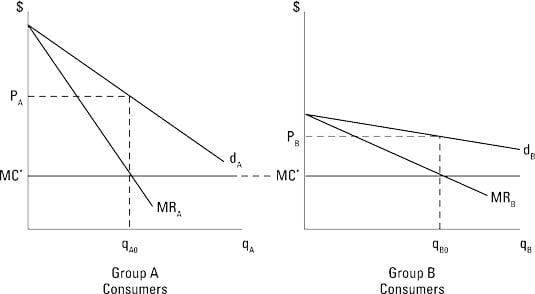
The illustration shows third-degree price discrimination. The curves labeled dA and MRA represent the demand and marginal revenue for the group A consumers. Because this demand curve is relatively steep, it’s less elastic. Similarly, the curves labeled dB and MRB represent the demand and marginal revenue for group B consumers. Group B’s flatter demand curve indicates a more elastic demand.
The marginal cost of the last unit you produce is constant and labeled MC*. The profit-maximizing quantity for each group corresponds to the output where the group’s marginal revenue equals marginal cost.
To determine price, you go from the profit-maximizing output level up to the group’s demand curve and across to the vertical axis. For group A, the profit-maximizing quantity is qA0 and the price is PA. For group B, the profit-maximizing quantity is qB0 and the price is PB.