Charging different prices for different ranges or blocks of output from your company results in second-degree price discrimination or declining block pricing. Typically, consumers pay one price for the first, small block of output, and lower prices for additional ranges or blocks of output.
Electric companies frequently use this type of price discrimination. For example, an electric company charges 9 cents per kilowatt hour for the first 300 kilowatt hours of electricity used in a month, 5 cents per kilowatt hour for the block 301 to 1,000 kilowatt hours, and 4 cents for each kilowatt hour over 1,000.
A firm engaging in second-degree price discrimination faces a marginal revenue curve that appears as a series of steps. The marginal revenue curve is a horizontal line corresponding to the price for that block of output. The illustration shows second-degree price discrimination.
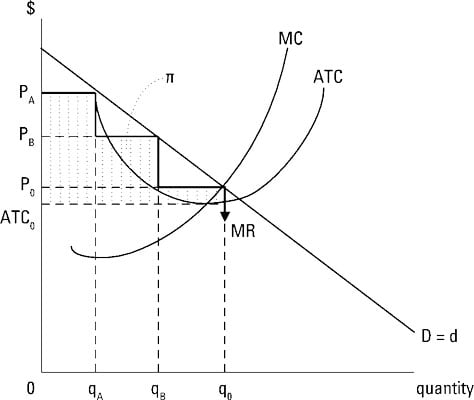
The marginal-cost, MC, and average-total-cost, ATC, curves have the typical shape. The firm illustrated represents a monopoly so the downward-sloping market demand corresponds to the firm’s demand curve, D = d.
To derive the marginal-revenue curve, note for the block of output from 0 to qA, you charge PA for each unit of output. Thus, each unit adds PA to your total revenue and PA is your marginal revenue. For the block of output from qA to qB, you charge the lower PB and your marginal revenue “steps down” to correspond to PB.
For the block of output from qB to q0, you again lower price, this time to P0, and marginal revenue takes another step down to P0. To sell more units of output beyond q0, you have to further lower price, so marginal revenue continues to take steps down. Marginal revenue, MR, reflects this series of steps.
The profit-maximizing firm always produces the output level corresponding to marginal revenue equals marginal cost. This is the output level q0 illustrated. The firm doesn’t charge a single price. Instead, the firm charges the price PA for the block of output from 0 to qA, PB for the block of output from qA to qB, and P0 for the remaining output.
The amount of profit the firm receives for each unit is the difference between price and average total cost, so the shaded area labeled with the symbol ð represents the firm’s total profit. Note that the profit area in second-degree price discrimination is smaller than the profit area illustrated for first-degree price discrimination.