
How do the scientists know what they know? When it comes to gathering information, scientists usually rely on the scientific method.
The scientific method is a plan that is followed in performing a scientific experiment and writing up the results. It is not a set of instructions for just one experiment, nor was it designed by just one person. The scientific method has evolved over time after many scientists performed experiments and wanted to communicate their results to other scientists. The scientific method allows experiments to be duplicated and results to be communicated uniformly.
As you're about to see, the format of the scientific method is very logical. Really, many people solve problems and answer questions every day in the same way that experiments are designed.
Hypothetically speaking
When preparing to do research, a scientist must form a hypothesis, which is an educated guess about a particular problem or idea, and then work to support it and prove that it is correct, or refute it and prove that it is wrong.
Whether the scientist is right or wrong is not as important as whether he or she sets up an experiment that can be repeated by other scientists, who expect to reach the same conclusion.
The value of variables
Experiments must have the ability to be duplicated because the "answers" the scientist comes up with (whether it supports or refutes the original hypothesis) cannot become part of the knowledge base unless other scientists can perform the exact same experiment(s) and achieve the same result; otherwise, the experiment is useless.
"Why is it useless," you ask? Well, there are things called variables. Variables vary: They change, they differ, and they are not the same. A well-designed experiment needs to have an independent variable and a dependent variable. The independent variable is what the scientist manipulates in the experiment. The dependent variable changes based on how the independent variable is manipulated. Therefore, the dependent variable provides the data for the experiment.
Experiments must contain the following steps to be considered "good science."
1. A scientist must keep track of the information by recording the data.
The data should be presented visually, if possible, such as through a graph or table.
2. A control must be used.
That way, results can be compared to something.
3. Conclusions must be drawn from the results.
4. Errors must be reported.
Suppose that you wonder whether you can run a marathon faster when you eat pasta the night before or when you drink coffee the morning of the race. Your hunch is that loading up on pasta will give you the energy to run faster the next day. A proper hypothesis would be something like, "The time it takes to run a marathon is improved by consuming large quantities of carbohydrates pre-race." The independent variable is the consumption of pasta, and the dependent variable is how fast you run the race.
Think of it this way: How fast you run depends on the pasta, so how fast you run is the dependent variable. Now, if you eat several plates of spaghetti the night before you race, but then get up the next morning and drink two cups of coffee before you head to the start line, your experiment is useless.
Why is it useless? By drinking the coffee, you introduce a second independent variable, so you will not know whether the faster race time is due to the pasta or the coffee. Experiments can have only one independent variable. If you want to know the effect of caffeine (or extra sleep or improved training) on your race time, you would have to design a second (or third or fourth) experiment.
Checking your stats
Of course these experiments would have to be performed many times by many different runners to demonstrate any valid statistical significance. Statistical significance is a mathematical measure of the validity of an experiment. If an experiment is performed repeatedly and the results are within a narrow margin, the results are said to be significant when measured using the branch of mathematics called statistics. If results are all over the board, they are not that significant because one definite conclusion cannot be drawn from the data.
Tracking the information
Once an experiment is designed properly, you can begin keeping track of the information you gather through the experiment. In an experiment testing whether eating pasta the night before a marathon improves the running time, suppose that you eat a plate of noodles the night before and then drink only water the morning of the race. You could record your times at each mile along the 26-mile route to keep track of information. Then, for the next marathon you run (boy, you must be in great shape), you eat only meat the night before the race, and you down three espressos on race morning. Again, you would record your times at each mile along the route.
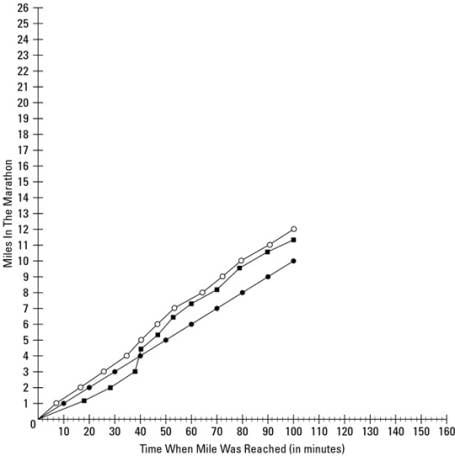
What do you do with the information you gather during experiments? Well, you can graph it for a visual comparison of results from two or more experiments. The independent variable from each experiment is plotted on the x-axis (the one that runs horizontally), and the dependent variable is plotted on the y-axis (the one that runs vertically). In experiments comparing the time it took to run a marathon after eating pasta the night before, getting extra sleep, drinking coffee, or whatever other independent variable you may want to try, miles 1 to 26 would be labeled up the y-axis. The factor that does not change in all the experiments is that a marathon is 26 miles long. The time it took to reach each mile would be plotted along the x-axis. This data might vary based on what the runner changed before the race, such as diet, sleep, or training. You can plot several independent variables on the same graph by using different colors or different styles of lines. Your graph might look something like the one in Figure 1.
Taking control of your experiment
How would you know if your race times were improved either by eating pasta or drinking coffee? You would have to run a marathon without eating pasta the night before or drinking coffee the morning of the race. (Exhausted yet?) This marathon would be your control. A control is a set of base values against which you compare the data from your experiments. Otherwise, you would have no idea if your results were better, worse, or the same.
Drawing conclusions
So, maybe it took you less time to reach each mile along the marathon route after the night of pasta eating, but your race times after drinking the coffee matched those of the control. That would support your initial hypothesis, but it would refute your second hypothesis. There's nothing wrong with being wrong, as long as the information is useful. Knowing what doesn't work is just as important as knowing what does.
Your conclusion to these two experiments would be something like: "Consuming pasta the night before a 26-mile marathon improves race time, but consuming caffeine has no effect."
However, in scientific experiments you have to confess your mistakes. This confession lets other scientists know what could be affecting your results. Then, if they choose to repeat the experiment, they can correct for those mistakes and provide additional beneficial information to the knowledge base. In the pasta-caffeine-race experiment, if you had consumed the pasta the night before and then the caffeine the morning of the race, your major error would be that of including more than one independent variable.
Another error would be having too small of a sample. A more accurate determination could be made by recording the race times at each mile for many runners under the same conditions (i.e., having them eat the same amount of pasta the night before a race or consuming the same amount of caffeine the morning of a race). Of course, their individual control times without those variables would have to be taken into account. Science. It's all in the details.