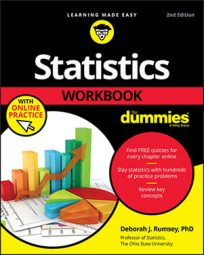
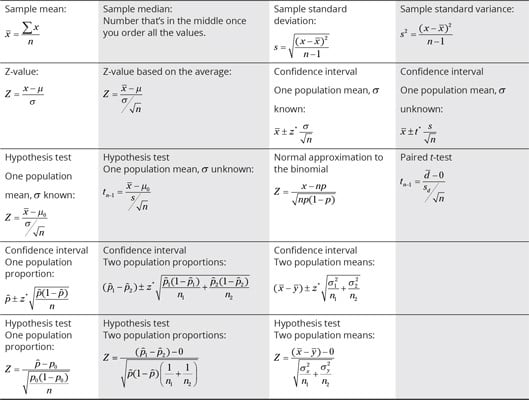
Basic statistics formulas you need
In statistics the formulas add up until at the end you have quite a group. The following table presents statistics formulas organize based on when they are typically found in a statistics class, from to bottom. It starts with the sample mean, median, and standard deviation, moving on to Z-values, confidence intervals and hypothesis tests for a mean and a proportion, and the difference of two means and two proportions, plus the formula to use for the normal approximation to the binomial. You can use it to help you determine and remember which formula to use when.
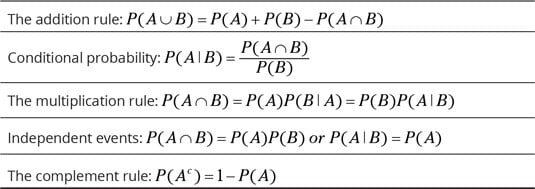
Important probability definitions and rules
The following table presents the most important probability rules (the addition rule, the multiplication rule, and the complement rule) as well as the well-loved definition of independence and conditional probability. Lots of notation in these rules and definitions.
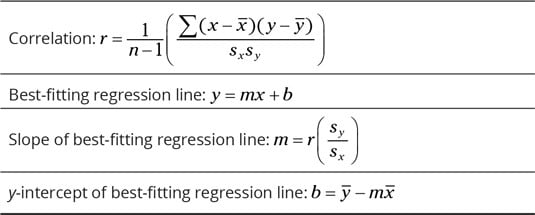
Correlation and regression formulas
Correlation and regression are super important — and useful. Here you find formulas for correlation and the best fitting regression line, as well as the individual formulas for the slope and y-intercept of the best fitting line.
10 ways to spot common statistical mistakes
Use these everyday reminders in and out of class to help spot common statistical mistakes, either in your own work or in the work of others. Focus on the ways that things can go wrong in statistics: look for misleading graphs, search for bias, ask for the sample size and margin of error, know how the sample was selected, check for confounding variables, think about the value of the correlation, and last but not least, check the math. Avoid selective reporting, and don’t put much stock in anecdotes.
- Scrutinize graphs.
Watch the scale, the number of bars/slices, the sample size, and the source. - Search for and specify bias.
Bias is systematic favoritism and can occur in sample selection, data collection, and in graphs and analyses. - Mark the margin of error.
Every poll has a margin of error; it’s important to look for theirs and report yours. - Scan for sample size.
Sample size plays a big role in how precise the data is, if all goes well, so knowing its value is important - Study sample selection — it’s gotta be random.
A random sample gives each group of the same size the same chance to be selected. Without this chance, bias can quickly occur. - Check for confounding variables.
Confounding variables are ones that were not included in a study but can influence the results. They are a major source of bias. - Consider correlation.
Finding the correlation is step 1; interpreting it is step 2. Make sure a correlation is at least beyond the weak range before believing the results; that is, beyond –0.3 and +0.3. The closer to plus or minus 1, the better. - Do the math.
Math mistakes are possible; double-check your work and the work of others before diving into the interpretation of the results. - Detect selective reporting.
Selective reporting is where folks leave out the stuff that didn’t work out and only point your attention to the exciting results that may not represent the big picture. - Avoid the anecdote.
Anecdotes are stories, which represent samples of size 1. We need more data than that before putting credence in results.