
When the sample size is large (at least 30), or you know its standard deviation, you typically use critical values on the Z-distribution to build the margin of error. When the sample size is small (less than 30) and/or the population standard deviation is unknown, you use the t-distribution to find critical values. (At roughly 25 or 30 degrees of freedom, the values of the t-distribution begin to match those of the Z-distribution. So, a sample size of 30 is not an must-have requirement, but it'll work well in many situations.)
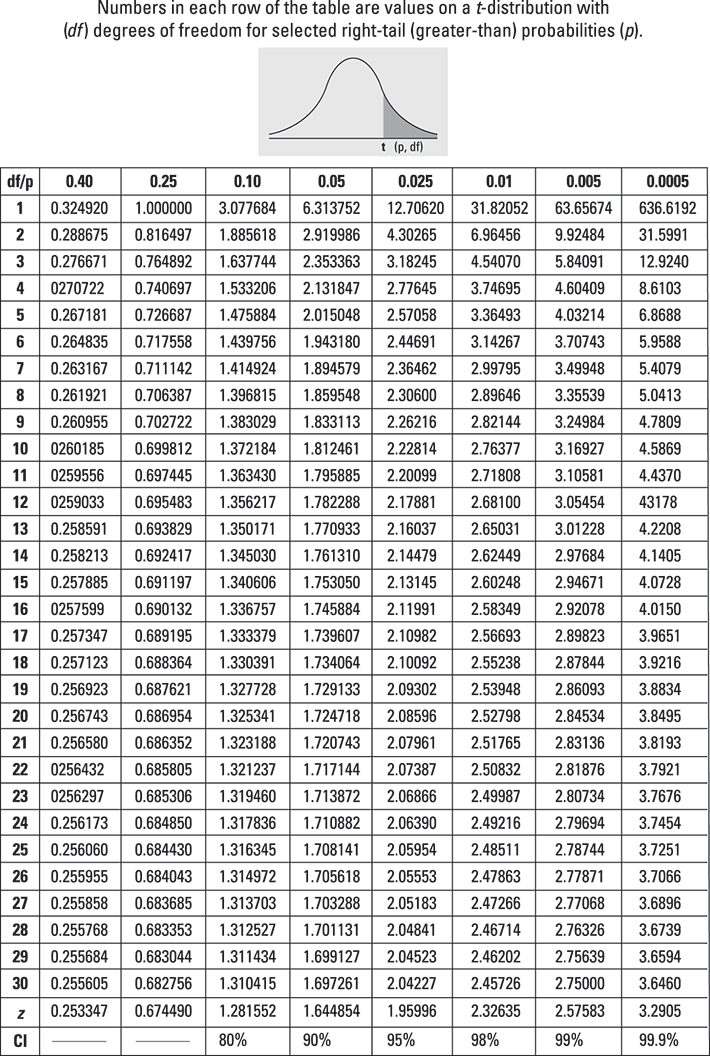
To help you find critical values for the t-distribution, you can use the last row of the t-table, which lists common confidence levels, such as 80%, 90%, and 95%. To find a critical value, look up your confidence level in the bottom row of the table; this tells you which column of the t-table you need. Intersect this column with the row for your df (degrees of freedom). The number you see is the critical value (or the t-value) for your confidence interval. For example, if you want a t-value for a 90% confidence interval when you have 9 degrees of freedom, go to the bottom of the table, find the column for 90%, and intersect it with the row for df = 9. This gives you a t-value of 1.833 (rounded).
Across the top row of the t-table, you see right-tail probabilities for the t-distribution. But confidence intervals involve both left- and right-tail probabilities (because you add and subtract the margin of error). So half of the probability left from the confidence interval goes into each tail. You need to take that into account. For example, a t-value for a 90% confidence interval has 5% for its greater-than probability and 5% for its less-than probability (taking 100% minus 90% and dividing by 2). Using the top row of the t-table, you would have to look for 0.05 (rather than 10%, as you might be inclined to do.) But using the bottom row of the table, you just look for 90%. (The result you get using either method ends up being in the same column.)
When looking for t-values for confidence intervals, use the bottom row of the t-table as your guide, rather than the headings at the top of the table.