
where ρ is the sample proportion, n is the sample size, and z* is the appropriate z*-value for your desired level of confidence (from the following table).
| z*-Values for Selected (Percentage) Confidence Levels | |
| Percentage Confidence | z*-Value |
|---|---|
| 80 | 1.28 |
| 90 | 1.645 |
| 95 | 1.96 |
| 98 | 2.33 |
| 99 | 2.58 |
Here are the steps for calculating the margin of error for a sample proportion:
-
Find the sample size, n, and the sample proportion.
The sample proportion ρ is the number in the sample with the characteristic of interest, divided by n.
-
Multiply the sample proportion by 1 - ρ.
-
Divide the result by n.
-
Take the square root of the calculated value.
You now have the standard error,

-
Multiply the result by the appropriate z*-value for the confidence level desired.
Refer to the above table for the appropriate z*-value. If the confidence level is 95 percent, the z*-value is 1.96.
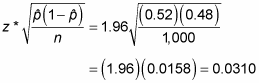
According to this data, you conclude with 95 percent confidence that 52 percent of all Americans approve of the president, plus or minus 3.1 percent.
Two conditions need to be met in order to use a z*-value in the formula for the margin of error for a sample proportion:
-
You need to be sure that nρ is at least 10.
-
You need to make sure that n(1 - ρ) is at least 10.
Now check the conditions:
Both of these numbers are at least 10, so everything is okay.
Most surveys you come across are based on hundreds or even thousands of people, so meeting these two conditions is usually a piece of cake (unless the sample proportion is very large or very small, requiring a larger sample size to make the conditions work).
A sample proportion is the decimal version of the sample percentage. In other words, if you have a sample percentage of 5 percent, you must use 0.05 in the formula, not 5. To change a percentage into decimal form, simply divide by 100. After all your calculations are finished, you can change back to a percentage by multiplying your final answer by 100 percent.
The number of standard errors you have to add or subtract to get the margin of error, or MOE, depends on how confident you want to be in your results (this is called your confidence level).Typically, you want to be about 95 percent confident, so the basic rule is to add or subtract about 2 standard errors (1.96, to be exact) to get the MOE (you get this from the Empirical Rule). This allows you to account for about 95 percent of all possible results that may have occurred with repeated sampling. To be 99 percent confident, you add and subtract 2.58 standard errors. (This assumes a normal distribution on large n; standard deviation known.) However, if you use a larger confidence percentage, then your MOE will be larger — so there is a tradeoff.