
The Empirical Rule (68-95-99.7) says that if the population of a statistical data set has a normal distribution (where the data are in the shape of a bell curve) with population mean µ and standard deviation
then following conditions are true:
About 68% of the values lie within 1 standard deviation of the mean (or between the mean minus 1 times the standard deviation, and the mean plus 1 times the standard deviation). In statistical notation, this is represented as

About 95% of the values lie within 2 standard deviations of the mean (or between the mean minus 2 times the standard deviation, and the mean plus 2 times the standard deviation). The statistical notation for this is

About 99.7% of the values lie within 3 standard deviations of the mean (or between the mean minus 3 times the standard deviation and the mean plus 3 times the standard deviation). Statisticians use the following notation to represent this:

The Empirical Rule is also known as the 68-95-99.7 Rule, in correspondence with those three properties. It’s used to describe a population rather than a sample, but you can also use it to help you decide whether a sample of data came from a normal distribution. If a sample is large enough and you can see that its histogram looks close to a bell-shape, you can check to see whether the data follow the 68-95-99.7 percent specifications. If yes, it’s reasonable to conclude the data came from a normal distribution.
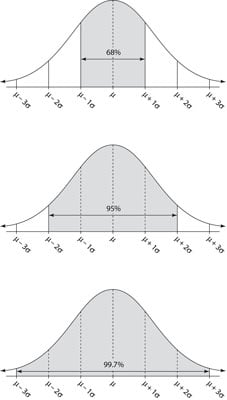
This figure illustrates all three components of the Empirical Rule. The reason that so many (about 68%) of the values lie within 1 standard deviation of the mean in the Empirical Rule is because when the data are bell-shaped, the majority of the values are mounded up in the middle, close to the mean (as the figure shows).
Adding another standard deviation on either side of the mean increases the percentage from 68 to 95, which is a big jump and gives a good idea of where “most” of the data are located. Most researchers stay with the 95% range (rather than 99.7%) for reporting their results, because increasing the range to 3 standard deviations on either side of the mean (rather than just 2) doesn’t seem worthwhile, just to pick up another 4.7% of the values.
The Empirical Rule tells you about what percentage of values are within a certain range of the mean. These results are approximations only, and they only apply if the data follow a normal distribution. However, the Empirical Rule is an important result in statistics because the concept of “going out about two standard deviations to get about 95% of the values” is one that you see mentioned often with confidence intervals and hypothesis tests.