


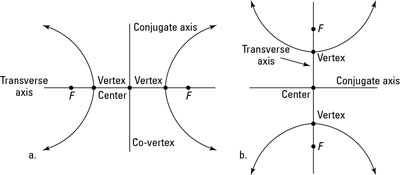
When graphing a hyperbola, you can think of it as a mix of two parabolas — each one a perfect mirror image of the other, and each opening away from one another. The mathematical definition of a hyperbola is the set of all points where the difference in the distance from two fixed points (called the foci) is constant. Hyperbolas come in two types: horizontal and vertical.
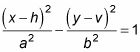
The equation for a horizontal hyperbola is
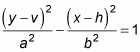
The equation for a vertical hyperbola is
To graph a hyperbola, such as this example,
you follow these simple steps:
Mark the center.
Because this equation is for a vertical hyperbola, you find that the center (h, v) of this hyperbola is (–1, 3). Remember, the signs of the numbers inside the parentheses are opposite those of the coordinates of the center. Also remember that h is inside the parentheses with x, and v is inside the parentheses with y. For this example, the quantity with y squared comes first, but h and v don't switch places. The h and v always remain true to their respective variables, x and y.
From the center in Step 1, find the transverse and conjugate axes.
Go up and down the transverse axis a distance of 4 (because 42 is under y), and then go right and left 3 (because 32 is under x). But don't connect the dots to get an ellipse! Up until now, the steps of drawing a hyperbola were exactly the same as for drawing an ellipse, but here is where things get different: The points you marked as a (on the transverse axis) are your vertices.
Use these points to draw a rectangle that will help guide the shape of your hyperbola.
Because you went up and down 4, the height of your rectangle is 8; going left and right 3 gives you a width of 6.
Draw diagonal lines through the center and the corners of the rectangle that extend beyond the rectangle.
This step gives you two lines that will be your asymptotes.
Sketch the curves.
Beginning at each vertex separately, draw the curves that approach the asymptotes the farther away from the vertices the curve gets. The graph approaches the asymptotes but never actually touches them.
 Creating a rectangle to graph a hyperbola with asymptotes.
This figure shows the finished hyperbola.
