This is called the center-radius form (or standard form) because it gives you both pieces of information at the same time. The h and v represent the center of the circle at point (h, v), and r names the radius. Specifically, h represents the horizontal displacement — how far to the left or to the right the center of the circle falls from the y-axis. The variable v represents the vertical displacement — how far above or below the center falls from the x-axis.
You can count from the center r units (the radius) horizontally in both directions and vertically in both directions. This will give you four different points, all equidistant from the center. Connect these four points with the best curve that you can sketch to get the graph of the circle.
Center at the origin
The simplest circle to graph has its center at the origin (0, 0). Because both h and v are zero, they can disappear and you can simplify the standard circle equation to look likeFor instance, to graph the circle
follow these steps:
-
Realize that the circle is centered at the origin (no h and v) and place this point there.
-
Calculate the radius by solving for r.
Set r-squared = 16. In this case, you get r = 4.
-
Plot the radius points on the coordinate plane.
You count out 4 in every direction from the center (0, 0): left, right, up, and down.
-
Connect the dots to graph the circle using a smooth, round curve.
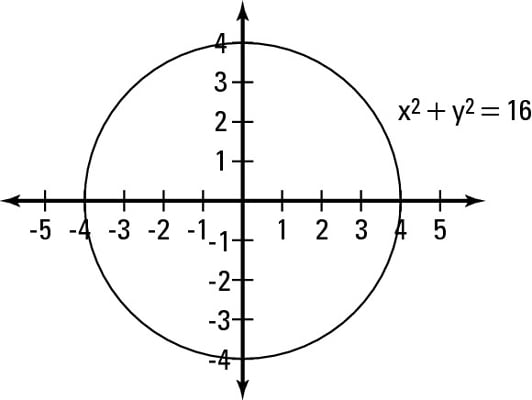
This figure shows this circle on the plane.
Center away from the origin
Graphing a circle anywhere on the coordinate plane is pretty easy when its equation appears in center-radius form. All you do is plot the center of the circle at (h, k), and then count out from the center r units in the four directions (up, down, left, right). Then, connect those four points with a nice, round circle.Unfortunately, while it is much easier to graph circles at the origin, very few are as straightforward and simple as those. In pre-calc, you work with transforming graphs of all different shapes and sizes (this is nothing new to you, right?). Fortunately, these graphs all follow the same pattern for horizontal and vertical shifts, so you don’t have to remember many rules.
Don’t forget to switch the sign of the h and v from inside the parentheses in the equation. This is necessary because the h and v are inside the grouping symbols, which means that the shift happens opposite from what you would think.
For example, to graph the equation-
Locate the center of the circle from the equation (h, v).
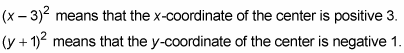
Place the center of the circle at (3, –1).
-
Calculate the radius by solving for r.

-
Plot the radius points on the coordinate plane.
Count 5 units up, down, left, and right from the center at (3, –1). This means that you should have points at (8, –1), (–2, –1), (3, –6), and (3, 4).
-
Connect the dots to the graph of the circle with a round, smooth curve.
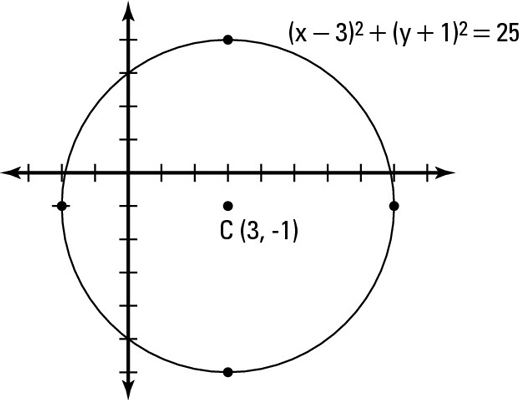
This figure gives you a visual representation of this circle.