
The first step in finding a function’s local extrema is to find its critical numbers (the x-values of the critical points). You then use the First Derivative Test. This test is based on the Nobel-prize-caliber ideas that as you go over the top of a hill, first you go up and then you go down, and that when you drive into and out of a valley, you go down and then up. This calculus stuff is pretty amazing, eh?
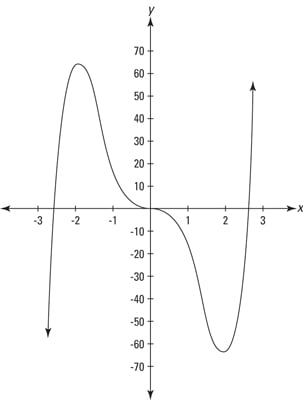
The figure shows the graph of
To find the critical numbers of this function, here’s what you do:
-
Find the first derivative of f using the power rule.
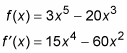
-
Set the derivative equal to zero and solve for x.
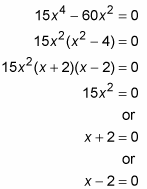
x = 0, –2, or 2.
These three x-values are the critical numbers of f. Additional critical numbers could exist if the first derivative were undefined at some x-values, but because the derivative

is defined for all input values, the above solution set, 0, –2, and 2, is the complete list of critical numbers. Because the derivative (and the slope) of f equals zero at these three critical numbers, the curve has horizontal tangents at these numbers.
-
Take a number line and put down the critical numbers you have found: 0, –2, and 2.
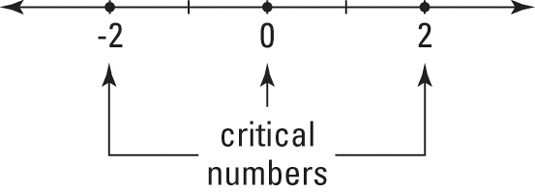
You divide this number line into four regions: to the left of –2, from –2 to 0, from 0 to 2, and to the right of 2.
-
Pick a value from each region, plug it into the first derivative, and note whether your result is positive or negative.
For this example, you can use the numbers –3, –1, 1, and 3 to test the regions.
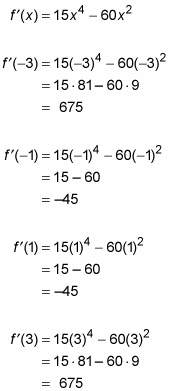
These four results are, respectively, positive, negative, negative, and positive.
-
Take your number line, mark each region with the appropriate positive or negative sign, and indicate where the function is increasing and decreasing.
It’s increasing where the derivative is positive, and decreasing where the derivative is negative. The result is a so-called sign graph for the function.
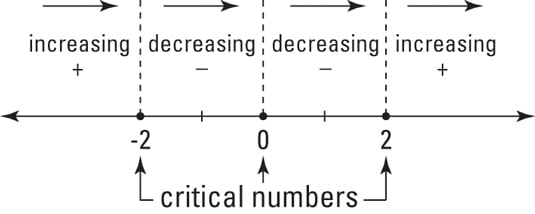
This figure simply tells you what you already know if you’ve looked at the graph of f — that the function goes up until –2, down from –2 to 0, further down from 0 to 2, and up again from 2 on.
Now, here’s the rocket science. The function switches from increasing to decreasing at –2; in other words, you go up to –2 and then down. So, at –2, you have a hill or a local maximum. Conversely, because the function switches from decreasing to increasing at 2, you have a valley there or a local minimum. And because the sign of the first derivative doesn’t switch at zero, there’s neither a min nor a max at that x-value.
-
Obtain the function values (in other words, the heights) of these two local extrema by plugging the x-values into the original function.
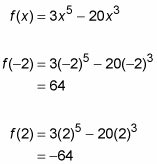
Thus, the local max is located at (–2, 64), and the local min is at (2, –64). You’re done.
To use the First Derivative Test to test for a local extremum at a particular critical number, the function must be continuous at that x-value.