Do you think you could come up with a better line of best fit than your TI-84 Plus calculator did with its regression line? Go ahead and try! Manual Linear Fit enables you to visually find a line of best fit of the form Y=mX+b. Here are the steps for using Manual Linear Fit:
Press [Y=] and deselect any functions that would graph by pressing [ENTER] on the corresponding equal sign.
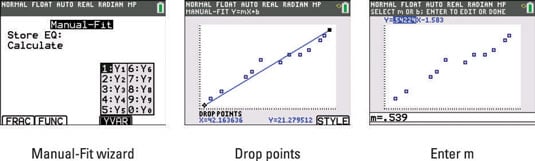
To open the Manual-Fit Wizard, press
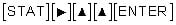
Manual-Fit is located near the bottom of the Stat CALC menu. On the TI-84 Plus, it is the last entry in this menu.
With your cursor on Store EQ, press [ALPHA][TRACE] to access the shortcut Y-VAR menu.
See the first screen. Enter the number of the Y-VAR you want. Press the down arrow to Highlight CALCULATE and press [ENTER].
Use the arrow keys to navigate your cursor near the data point closest to the right part of the screen and press [ENTER].
Two points determine a line; this establishes a point on the Manual-Fit line. As you move your cursor, the Manual-Fit line behaves like a moveable line as shown in the second screen.
Use the arrow keys to navigate your cursor near the data point closest to the left part of the screen and press [ENTER].
The Manual-Fit line is now drawn with the equation shown in the border at the top of the graph screen.
The TI-84 Plus C displays functions and information in the border of the graph screen. The TI-84 Plus displays similar information directly on the graph screen.
Use the left- and right-arrow keys to toggle the highlighted parameter values from m to b in the Manual-Fit line equation of the form, Y=mX+b.
Enter a value for the highlighted parameter value to adjust the fit of your line.
Notice, an entry line opens at the bottom of the screen as you enter a value for one of the parameters. See the third screen. Press [ENTER] to change the parameter in the equation and watch the graph automatically adjust.
Press [GRAPH] to activate the on-screen prompt, DONE and then press [2nd][MODE] to exit the graph screen.
This action stores the function and brings your cursor to the Home screen. On the TI-84 Plus, press [2nd][MODE] to store the function.