
As you should know for the PMP Certification Exam, the first step to quantifying uncertainty is to get more information. This is generally done via research and interviewing subject matter experts. Because quantitative risk analysis is associated with the schedule and cost objectives, focus on those estimates. Assume that you’re gathering cost estimates to determine whether a budget of $2.5 million is sufficient for a childcare center.
Here are the steps you would take:
Revisit your cost estimates and get an optimistic, a pessimistic, and a most-likely estimate for each WBS element.
Sum the optimistic, pessimistic, and most-likely estimates for the project as a whole.
Document your assumptions, basis of estimates, and rationale for each set of estimates.
Apply the PERT equation to the estimates.
This gives you an expected cost for each element and the project as a whole.
Use software to create a probability distribution of the values.
Compare the sum of the most likely estimates with the sum of the expected value estimate.
The PMP exam will use the PERT (Program Evaluation and Review Technique) equation on duration and cost estimating. That equation is
(optimistic + 4 (most likely) + pessimistic) / 6
You’ll almost always find the sum of the most likely to be significantly less than the sum of the expected value. And because the expected value is the 50% probability figure, you will discover that your “most likely” estimate is not very likely at all!
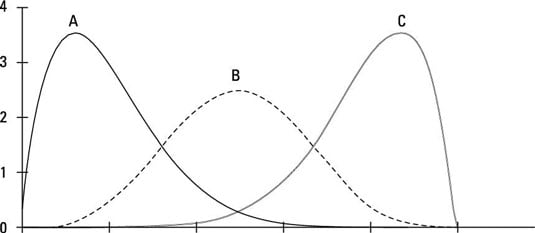
The three curves represent three different scenarios. Curve A indicates that the optimistic and most likely estimates are close together and that the pessimistic estimate is significantly greater. Curve B indicates that all three values are evenly distributed. Curve C indicates that the optimistic value is significantly less than the most likely and pessimistic values, which are close together.
Curve A is a common occurrence because generally, the best case scenario and most likely are not that far off. However, if things really go wrong, the worst case scenario can be really bad! In Curve A, your expected value will be higher than your most likely value.